Meta-Analysis of Genetic Variants in Lung Cancer: Quantile-Quantile and Manhattan Plots
90 likes | 197 Vues
This study presents a comprehensive meta-analysis of lung cancer genetic variants, encompassing individual studies from renowned cancer centers. We utilized quantile-quantile plots in -log10 scale to assess the concordance of observed and expected p-values across multiple Genome-Wide Association Studies (GWAS). The findings include inflation factors for bottom SNPs across distinct studies and highlight significant variants associated with various lung cancer subtypes, stratified by demographics such as gender and smoking history. Detailed regional plots further elucidate key loci contributing to lung cancer risk.

Meta-Analysis of Genetic Variants in Lung Cancer: Quantile-Quantile and Manhattan Plots
E N D
Presentation Transcript
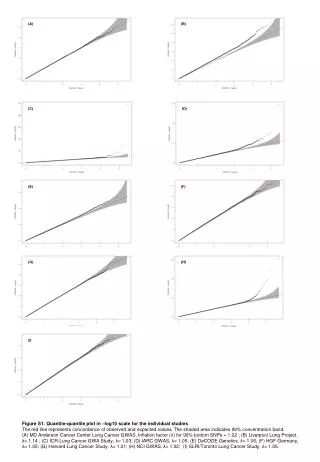
(A) (B) (C) (D) (E) (F) (G) (H) (I) Figure S1. Quantile-quantile plot in –log10 scale for the individual studies The red line represents concordance of observed and expected values. The shaded area indicates 99% concentration band. (A) MD Anderson Cancer Center Lung Cancer GWAS. Inflation factor (λ) for 90% bottom SNPs = 1.02 ; (B) Liverpool Lung Project, λ= 1.14 ; (C) ICR-Lung Cancer GWA Study, λ= 1.03; (D) IARC GWAS, λ= 1.05; (E) DeCODE Genetics, λ= 1.06; (F) HGF Germany, λ= 1.05; (G) Harvard Lung Cancer Study, λ= 1.01; (H) NCI GWAS, λ= 1.02; (I) SLRI/Toronto Lung Cancer Study, λ= 1.05.
(B) (A) B -log10(P-value) -log10(Observed P-value) Chromosome -log10(expected P-value) Figure S2. Meta-analyses results: random effects model (A) Manhattan plot of P-values for the fixed effect model. Combined P values were derived from the per-allele model. Core 318,094 SNPs corresponding to the Illumina HumanHap 300 BeadChips array are shown at the Manhattan plots as round-shaped. Additional 217,914 SNPs corresponding to the Illumina HumanHap550 array are shown as triangle-shaped. (B) Quantile-quantile plot for P-values in –log10 scale for the fixed effect model for the core 318,094 SNPs. Inflation factor (λ) for the 90% bottom SNPs = 1.10. The red line represents concordance of observed and expected values. The shaded area indicates 99% concentration band.
(B) Women 90% bottom λ = 1.03 (F) Ever Smokers 90% bottom λ = 1.09 (A) Men 90% bottom λ =1.05 (C) Never Smokers (D) Former Smokers 90% bottom λ = 1.03 90% bottom λ = 1.01 (E) Current Smokers 90% bottom λ = 1.05 (H) Small cell carcinoma (G) Large cell carcinoma 90% bottom λ = 1.0 90% bottom λ = 1.03
(I) Early onset lung cancer (J) Later onset lung cancer 90% bottom λ = 1.06 90% bottom λ = 1.01 (L) No Family History o f Lung Cancer (K) Family History o f lung cancer 90% bottom λ = 1.04 90% bottom λ = 1.07 (M) Stage 1 and 2 (N) Stage 3 and 4 90% bottom λ = 1.02 90% bottom λ = 1.04 Figure S3. Manhattan plots for the meta-analysis by specific subgroups: fixed effect model Combined P values were derived from the per-allele model. Core 318,094 SNPs corresponding to the Illumina HumanHap 300 BeadChips array are shown at the Manhattan plots as round-shaped. Additional 217,914 SNPs corresponding to the Illumina HumanHap550 array are shown as triangle-shaped. Manhattan plots for adenocarcinoma and squamous cell carcinoma are presented in the Figure 1.
(A) 2q32.1 (B) 5p15.33 (D) 9p21.3 (C) 6p22.3-6p21.31 (F) 15q25.1 (E) 12p13.33 Figure S4. Regional plot of the 2q32 (A), 5p15 (B), 6p21-6p22 (C), 9p21 (D), 12p13 (E) and 15q25 (F) loci using imputed data. For the 9p21, 2q32.1, 6p22.3 and 12p13.33 loci results are presented for the squamous cell carcinoma histology. Results (-log10P) are shown for SNPs genotyped and imputed within the region. The most significant SNP in the locus are shown diamond-shaped and the r2 values for the rest of the SNPs are indicated by different colours depending on the LD level in CEU population. The genes within the region are annotated and shown as arrows.
2q32.1, rs11683501, G1 cases controls p-value OR 95%CI Overall 2,338 3,077 0.72 0.98 0.91-1.07 By Gender (Phet =0.54) Men 1,717 2,084 0.49 0.97 0.88-1.06 Women 621 993 0.77 1.02 0.88-1.19 By Smoking (Phet =0.79) Never 829 1,266 0.88 0.99 0.86-1.13 Former 254 226 0.45 1.06 0.80-1.39 Current 1,255 1,585 0.71 0.95 0.85-1.08 By Histology (Phet =0.42) Adenocarcinoma 1,307 3,077 0.29 0.95 0.86-1.04 Squamous carcinoma 825 3,077 0.92 0.99 0.88-1.12 Small Cell Lung Cancer 179 3,077 0.35 1.11 0.89-1.39 By Age (Phet =0.88) <=50 399 442 1.00 1.00 0.80-1.25 >50 1,939 2,635 0.69 0.98 0.90-1.07 0.8 0.9 1.0 1.1 1.3 Odds ratio (95% CI) 12p13, rs10849605,T cases controls p-value OR 95%CI Overall 2,338 3,077 0.43 0.97 0.88-1.05 By Gender (Phet =0.72) Men 1,717 2,084 0.66 0.98 0.88-1.08 Women 621 993 0.49 0.94 0.80-1.11 By Smoking (Phet =0.26) Never 829 1,266 0.88 0.99 0.86-1.14 Former 254 226 0.06 0.76 0.56-1.02 Current 1,255 1,585 0.69 0.97 0.86-1.11 By Histology (Phet =0.98) Adenocarcinoma 1,307 3,077 0.49 0.96 0.87-1.07 Squamous carcinoma 825 3,077 0.45 0.95 0.84-1.08 Small Cell Lung Cancer 179 3,077 0.81 0.97 0.77-1.23 By Age (Phet =0.14) <=50 399 442 0.29 1.13 0.90-1.42 >50 1,939 2,635 0.19 0.94 0.85-1.03 0.6 0.8 1.0 1.2 1.4 Odds ratio (95% CI) (A) (B) CLPTM1L, rs401681, T cases controls p-value OR 95%CI Overall 2,338 3,077 0.005 0.88 0.81-0.96 By Gender (Phet=0.05) Men 1,717 2,084 0.19 0.93 0.84-1.03 Women 621 993 1.3*10-3 0.77 0.65-0.90 By Smoking (Phet=0.81) Never 829 1,266 0.02 0.84 0.72-0.97 Current 254 226 0.04 0.87 0.77-0.99 Former 1,255 1,585 0.63 0.93 0.69-1.25 By Histology (Phet= 0.82) Adenocarcinoma 1,307 3,077 4.4*10-3 0.86 0.77-0.95 Squamous carcinoma 825 3,077 0.13 0.90 0.79-1.03 Small Cell Lung Cancer 179 3,077 0.34 0.89 0.70-1.13 By Age (Phet=0.61) <=50 399 442 0.14 0.84 0.66-1.06 >50 1,939 2,635 0.02 0.89 0.81-0.98 0.7 0.8 0.9 1.0 1.2 Odds ratio (95% CI) (C) (D) TERT, rs2736100, C cases controls p-value OR 95%CI 9p21, rs1333040,C cases controls p-value OR 95%CI Overall (RSQR= 0.99) 2,338 3,077 0.03 1.10 1.01-1.20 Overall 2,338 3,077 2.1*10-7 1.30 1.17-1.43 By Gender (Phet=0.77) By Gender (Phet=0.13) Men 1,717 2,084 0.06 1.11 1.00-1.23 Men 1,717 2,084 4.1*10-4 1.23 1.10-1.38 Women 621 993 0.20 1.07 0.91-1.27 Women 621 993 5.3*10-5 1.46 1.21-1.75 By Smoking (Phet=0.10) By Smoking (Phet=0.38) Never 829 1,266 0.54 0.95 0.82-1.11 Never 829 1,266 5.7*10-6 1.47 1.24-1.74 Current 254 226 0.01 1.18 1.04-1.34 Current 254 226 8.1*10-4 1.28 1.11-1.48 Former 1,255 1,585 0.44 1.14 0.84-1.53 Former 1,255 1,585 0.26 1.22 0.87-1.70 By Histology (Phet=0.22) By Histology (Phet=0.07) Adenocarcinoma 1,307 3,077 0.19 1.07 0.97-1.19 Adenocarcinoma 1,307 3,077 4.8*10-9 1.41 1.26-1.59 Squamous carcinoma 825 3,077 0.03 1.16 1.02-1.32 Squamous carcinoma 825 3,077 0.05 1.15 1.00-1.34 Small Cell Lung Cancer 179 3,077 0.46 0.91 0.72-1.16 Small Cell Lung Cancer 179 3,077 0.30 1.15 0.88-1.49 By Age (Phet=0.02) By Age (Phet=0.78) <=50 399 442 0.17 0.84 0.66-1.08 <=50 399 442 0.03 1.35 1.04-1.75 >50 1,939 2,635 2.8*10-3 1.16 1.05-1.27 >50 1,939 2,635 1.7*10-6 1.29 1.16-1.44 0.8 1.0 1.2 1.4 1.0 1.2 1.4 1.6 1.8 (E) Odds ratio (95% CI) (F) Odds ratio (95% CI) 15q25, rs6495309,T cases controls p-value OR 95%CI Overall (RSQR=0.45) 2,338 3,077 0.44 0.95 0.84-1.08 By Gender (Phet=0.41) Men 1,717 2,084 0.24 0.92 0.80-1.06 Women 621 993 0.82 1.03 0.82-1.29 By Smoking (Phet=0.12) Never 829 1,266 0.66 0.96 0.78-1.17 Current 254 226 0.12 0.87 0.73-1.04 Former 1,255 1,585 0.12 1.38 0.92-2.08 By Histology (Phet=0.69) Adenocarcinoma 1,307 3,077 0.75 0.98 0.85-1.13 Squamous carcinoma 825 3,077 0.18 0.88 0.74-1.06 Small Cell Lung Cancer 179 3,077 0.77 0.95 0.68-1.32 By Age (Phet=0.66) <=50 399 442 0.50 0.89 0.64-1.24 >50 1,939 2,635 0.61 0.97 0.85-1.10 1.0 1.5 2.0 Odds ratio (95% CI) Figure S5. Stratified Analysis of Association Between SNPs on 2q32 (A), 5p15 (B), 9p21 (C), 12p13 (D) and 15q25 (F) and the Risk of Lung Cancer in the Han Chinese population. Combined Odds Ratios (ORs) and 95%Confidence Intervals (CIs) were derived from the per-allele model. Squares represent odds ratios; size of the square represents inverse of the variance of the log odds ratio; horizontal lines represent 95% confidence intervals; diamonds represent summary estimate combining the study-specific estimates with a fixed-effects model; solid vertical lines represent an odds ratio of 1; dashed vertical lines represent the overall odds ratio. 1 For the 2q32 the most significant results were observed for the squamous cell carcinoma histology when adjusted by smoking status. Here the results for the model without additional adjustment for smoking is presented as results were similar between these two models (data not presented) in the Han Chinese population.
Figure S6. Regional plot 15q25 locus using imputed data in the Chinese Hap population. Results (-log10P) are shown for SNPs genotyped and imputed within the region. The most significant SNP in the locus are shown diamond-shaped and the r2 values for the rest of the SNPs are indicated by different colours depending on the LD level in CHB+JPT population. The genes within the region are annotated and shown as arrows. The known lung cancer variants rs16969968 (MAF=0.03, OR=0.37, P = 0.05) and rs1051730 (MAF=0.03, OR=0.34, P=0.05) were imputed in the Han Chinese with a low quality (RSQR<0.06) and did not pass the quality cut-off of RSQR > 0.30 to be included in the analysis.
15q15, rs504417, G cases controls p-value OR 95%CI Fixed effect model 14860 29385 1.2e-06 0.92 0.89-0.95 Random effects models 14860 29385 1.8e-04 0.91 0.87-0.96 By study (Phet = 0.10) IARC 2865 4228 0.43 0.97 0.90-1.05 SLRI 330 499 0.58 1.07 0.85-1.35 MDACC 1149 1134 0.003 0.82 0.72-0.94 deCode 830 11207 0.04 0.89 0.79-0.99 HGF 487 480 0.54 0.93 0.75-1.16 ICR 1949 2698 0.02 0.90 0.82-0.98 Liverpool 542 2499 6e-04 0.77 0.66-0.89 NCI 5724 5670 0.03 0.94 0.88-0.99 Harvard 984 970 0.61 0.96 0.84-1.11 By Gender (Phet =0.56 ) Men 8668 14836 0.001 0.93 0.89-0.97 Women 3701 9354 0.15 0.95 0.89-1.02 By Smoking (Phet =0.16)1 Never 924 9171 0.99 1.00 0.89-1.12 Former 4664 9608 4.9e-05 0.89 0.83-0.94 Current 8242 10212 0.02 0.94 0.89-0.99 Ever 13793 22342 2.9e-06 0.92 0.88-0.95 By Histology (Phet =0.87) Adenocarcinoma 4799 28389 0.02 0.94 0.89-0.99 Squamous carcinoma 4100 28534 0.001 0.91 0.86-0.96 Small Cell Lung Cancer 1967 26430 0.05 0.93 0.86-1.00 Large Cell Lung cancer 283 16578 0.52 0.94 0.78-1.13 By Stage NSCLC (Phet =0.64) Stage 1 and 2 2410 10971 0.08 0.94 0.87-1.01 Stage 3 and 4 3712 10971 0.004 0.92 0.86-0.97 By Family History of Lung cancer (Phet =0.62 ) yes 1924 7547 0.03 0.90 0.82-0.99 no 10618 25011 4.1e-05 0.92 0.89-0.96 By Age (Phet =3.8*10-4) <=50 1350 5066 0.04 1.11 1.00-1.23 >50 11018 19122 4.8e-06 0.91 0.88-0.95 0.7 0.9 1.1 1.3 Odds Ratios (95%CI) 2q32.1, rs11683501, G cases controls p-value OR 95%CI Fixed effect model 12248 24083 0.17 1.03 0.99-1.06 Random effects models 12248 24083 0.17 1.03 0.99-1.06 By study (Phet = 0.93) IARC 2763 4083 0.18 1.05 0.98-1.14 SLRI 331 499 0.43 0.92 0.74-1.14 MDACC 1149 1134 0.73 1.02 0.91-1.15 deCode 829 11227 0.75 1.02 0.92-1.13 HGF 487 480 0.72 0.95 0.74-1.23 NCI 5705 5690 0.36 1.03 0.97-1.08 Harvard 984 970 0.70 1.03 0.90-1.17 By Gender (Phet =0.22 ) Men 3678 4236 0.09 1.06 0.99-1.14 Women 2452 8438 0.92 1.00 0.92-1.07 By Smoking (Phet =0.03)1 Never 924 9189 0.09 0.91 0.82-1.01 Former 4664 9625 0.59 1.02 0.96-1.07 Current 8251 10213 0.01 1.06 1.01-1.11 Ever 13801 22376 0.02 1.04 1.01-1.08 By Histology (Phet =3*10-4) Adenocarcinoma 2327 17499 0.63 0.98 0.92-1.05 Squamous carcinoma 3256 23233 1.6x10⁻⁷ 1.17 1.10-1.24 Small lung cancer 1340 21129 0.74 1.01 0.93-1.10 Large lung cancer 113 12197 0.55 1.09 0.82-1.45 By Stage NSCLC (Phet =0.79) Stage 1 and 2 2312 8293 0.48 1.03 0.96-1.10 Stage 3 and 4 1339 2603 0.41 1.04 0.95-1.15 By Family History of Lung cancer (Phet =0.84) yes 763 1800 0.45 1.06 0.91-1.22 no 4261 15157 0.18 1.04 0.98-1.10 By Age (Phet=0.28 ) <=50 1222 4900 0.52 0.96 0.85-1.09 >50 10925 19059 0.12 1.03 0.99-1.07 0.8 1.0 1.2 Odds Ratios (95%CI) (A) (B) Figure S7.Stratified Analysis of Association Between SNPs on 2q32 (A) and 15q15.1 (B) and the Risk of Lung Cancer. Combined Odds Ratios (ORs) and 95%Confidence Intervals (CIs) were derived from the per-allele model. Results for fixed effect model are presented unless otherwise specified. Squares represent odds ratios; size of the square represents inverse of the variance of the log odds ratio; horizontal lines represent 95% confidence intervals; diamonds represent summary estimate combining the study-specific estimates with a fixed-effects model; solid vertical lines represent an odds ratio of 1; dashed vertical lines represent the overall odds ratio. For the 2q32 the most significant results were observed for the squamous cell carcinoma histology when adjusted by smoking status. Therefore results for the variant at chromosome 2 – rs11683501 are presented for the model adjusted by smoking for all subgroups except never, former, current and ever smokers where the models were not adjusted by smoking status. 1 Heterogeneity assessed between ever and never smoking groups. NSCLC – non small cell lung cancer
Figure S8. Power to detect lung cancer susceptibility alleles in the overall meta-analysis (black) and squamous cell histology (red). Power to identify susceptibility alleles was calculated over different minor allele frequencies (MAF) and for various effect sizes: RR=1.20 (solid lines), RR=1.10 (dot lines) and RR=1.05 (dashed lines). Power to detect 5p15 (rs401681, rs2736100), 6p21(rs3117582 ), 15q25 (rs6495309, rs1051730), 9p21 (rs1333040), 12p13 (rs10849605 ) and 15q15 (rs504417) SNPs was calculated for overall sample size (black dots) and, additionally, power to detect 9p21 (rs1333040) and 12p13 (rs10849605 ) variants was calculated for squamous cell carcinoma histology only (red dots). Power calculation was performed for log-additive model of inheritance using QUANTO 1.2.4 (Gauderman et al., 2002) and stipulating significance of 5*10-8.