ABGG Core Course Genetics and Behavior
330 likes | 433 Vues
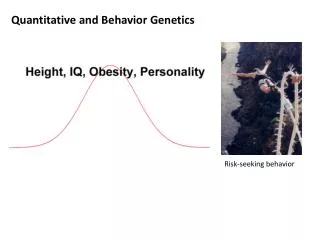
Explore genetic architecture, quantitative genetics, and genetic correlations in studying behavior evolution. Learn how heritability and genetic correlation influence behavior traits across populations.

ABGG Core Course Genetics and Behavior
E N D
Presentation Transcript
ABGG Core CourseGenetics and Behavior Andy Sih 4-7243 asih@ucdavis.edu
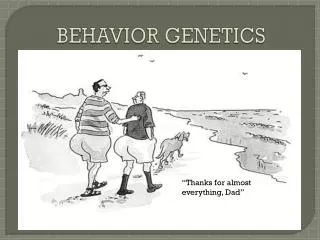
Why study genetics of behavior? • Adaptive evolution requires heritable variation and selection. • Behavioral ecologists use the ‘phenotypic gambit’ (Grafen 1984) to explain behavior based on current utility (optimality) – assume no genetic constraints.
What do we need to know about genetics?Genetic Architecture • Number of genes – a few vs. polygenic - faster evolution with fewer genes – but not if optimum outside of current genetic variation • Additive vs. non-additive (dominance, epistasis) – evolution easier to project with additive genetic variation • Genetic correlations – linking traits – pleiotropy vs. linkage
Coadapted gene complexes (epistasis) – associated with integrated phenotypes Location of genes –understanding (sex) linkage Candidate genes – linking genes to neuroendocrine mechanisms to behavior – e.g., DRD4 dopamine receptor Genomics
Quantitative genetics • Does not study genes themselves, but relies on statistical similarity of phenotypes in related individuals • Suitable for continuous traits controlled by many genes – e.g., behavior Key books: Falconer & Mackay 1996, Lynch & Walsh 1998 Phenotypic value (P) = genetic value (G) + environmental effect (E) + interaction (G x E) G x E is genetic variation in response to the environment Genetic value (G) = additive (A) + non-additive – including dominance, epistasis
Heritability Var(P) = var(G) + var(E) + 2Cov(G,E) Broad sense heritability = var(G)/ var(P) = H2 Var(G) = var(A) + non-additive genetic variation Narrow sense heritability = var(A)/ var(P) = h2 Var(ind) = between-individual differences in behavior = personality = var(G) + var(PE) Var (PE) = permanent environment effects Repeatability = var(ind)/var(P) Which is larger – heritability or repeatability? Genetic correlation between two traits x, y = rg = cov(x,y)/(var(x) var(y))0.5 Need genetic variation to have a genetic correlation
Why are h2 and rg important? Predicting evolution! (Lande and Arnold 1983) 1) For one trait: Δz = h2 s change in trait = heritability x selection 2) For 2 correlated traits: Δz(1) = h1 β1 + r(1,2) β2 Δz(2) = h2 β2 + r(2,1) β1 Evolution of each trait depends on correlation with the other and selection on the other. 3) For multiple traits Δz(i) = G β G = G matrix of genetic variances and covariances β = selection on each trait
Step 1 – is the behavior heritable? No need to estimate heritability precisely? • Common garden experiments – contrasting different populations • Preferably in 2 or more environments. Why? • Study the F2, not just F1. Why?
Estimating h2 1) Resemblance between relatives: parent/offspring, siblings (full or half), twins • Controlled breeding designs, constant environment • Pedigrees – the ‘animal’ model – can be applied to field populations – Kruuk 2003 2) Selection experiments: Δz = h s, so h = Δz/s • Select for x evolution of y – estimates genetic r(x,y) 3) Can’t do 1 or 2?
How heritable is behavior? Literature reviews: Mousseau and Roff 1987, Meffert2002, Van Oers and Sinn 2013 Mean heritability = • Domestic • Wild In wild populations: Activity Aggression Boldness Exploratory tendency
Some examples e.g., aggression – Drosophila, lab rodents, dogs, pigs, bluebirds, great tits, stickleback boldness – dogs, cows, squid, bighorn sheep coping style – lab rodents, paradise fish, great tits courtship – crickets, Drosophila, housefly, molly antipredator – garter snakes foraging – Drosophila, honeybees, garter snakes learning – blowfly, Drosophila, honeybee, mouse, pig, rat migration – armyworm, milkweed bug, mite, vole, warbler
How about humans?(Kendler and Greenspan 2006; Hatemi and McDermott 2012 Anxiety disorders Major depression Alcoholism Schizophrenia, autism Personality Sexual conservatism Military defense attitudes Economic attitudes Racial attitudes Social trust Punishment attitudes Liberal/conservative Political knowledge
Selection and genetic variation • Strong selection should reduce genetic variation YET – lots of genetic variation maintained! HOW?
Genetic correlations 1) Resemblance between relatives - Roff (1996) – literature review; N = 166 genetic r for behavior, 6 species Mean genetic r = 2) Selection line experiments – Drosophila, lab rodents, domesticated animals, great tits – YES – selection on one behavior drives correlated evolution of a suite of behaviors. (“Behavioral syndromes”) 3) Mutations – have numerous behavioral effects – demonstrates pleiotropy e.g., dunce gene in Drosophila – poor learning, also affects biorhythms, female mate receptivity, fertility, longevity
Phenotypic r is a good estimate of genetic r? • Phenotypic r ~ genetic r + environmental r • Roff (1996) – review – phenotypic correlations often ARE a good estimate of genetic correlations. • Lynch (1998) – theory – yes, if large sample sizes (e.g., 500) and at least 20% of the sample are relatives
Key issue: Constancy of the G matrix 1) Projecting evolution (future or past) assumes constancy of the G matrix. • Some evidence of constancy- comparing G matrices for similar species. 2) BUT selection should: • reduce h – select out deleterious alleles • alter r – differential epistasis – genes that modify pleiotropy • Lab expts show evolution of G in response to selection. 3) AND – simple evolutionary equations assume: • No G x E interaction = genetic variation in response to environmental variation • No G x E correlation = genetic variation in environments experienced
Phenotype Phenotype Environments Environments Reaction norms and G x EReaction norm = the pattern of phenotypic expression of a single genotype across a range of environmentsPhenotypic plasticity = change in phenotype in response to change in the environment No G x E Significant G x E
Genotypes differ in mean P • Do not differ in plasticity 1 2 1 P 3 2 P(E2) 3 E1 E2 P(E1) 1) Genotypes differ in plasticity 2) Do not differ in mean P Behavioral reaction norms Dingemanse et al. 2010 TREE 3 1 2 P(E2) 2 P 1 3 Plasticity as a trait (Scheiner 1993) E1 E2 P(E1) P = P + slope x E Slope = degree of plasticity Quantify QG of mean and slope (and polynomial terms for non-linear reaction norm) Character state approach to plasticity Reaction norm approach to plasticity P in each environment is a separate trait Quantify genetic correlations across environments (Via and Lande 1985)
Novel environment OUTSIDE of the ‘normal range’: human-altered ‘natural’ environments, captive environments:Extended reaction norms(West-Eberhard 2003; Ghalambor et al. 2007; Lande 2009) A B NEW OPTIMUM Evolutionary mismatch TRAIT X New Environment Past Environments
Baldwin effect (1896) • Plasticity (behavior, learning) allows some individuals to cope with a novel environment. • Facilitates evolution: allows NS to shape evolution of genetic adaptation to the new environment • later LOSS of plasticity (genetic assimilation) • OR – Reduces evolution
F1 Phenotype P F2 E1 E2 Evolution of adaptive plasticity Plasticity is not necessarily favored! WHY NOT?
Behavior E1 E2 But behavior is infinitely reversible with very short time lags? So, expect optimal plastic behavior? Maybe NOT! Alternative idea: individuals have consistent behavioral types (BTs) • Human personalities • Coping styles: proactive vs. reactive • Shy-bold continuum (D.S. Wilson 1994) • Behavioral syndromes (Sih et al. 2004) – aggressiveness, boldness, activity Growing literature that BTs are heritable in humans and other animals.
Evolutionary questions about behavioral genetic correlations Q: Why should individuals have a BT? Why not exhibit optimal behavioral plasticity? Q: Why are boldness and aggressiveness sometimes positively correlated, but other times not? E.g., stickleback fish (Bell 2005; Bell and Sih, unpubl data) • Population surveys – bold and aggressive are correlated under one predation regime, but not the other. Q: When are they correlated? Q: Why?
G x E correlations Different genotypes experience different environments
Implications of behavioral G x E correlation • Alters selection on each genotype • Increases positive assortative interactions 3) Allows specialization 4) Divergence and maintenance of variation
A (mom) A (off) M Maternal Environment Trait (mom) Trait (off) Env (mom) Env (off) M = maternal effects coefficient Genetics of social behaviorIndirect genetic effects (IGEs)I. maternal effects • Part of offspring environment is provided by mom: • parental care, oviposition/nest site • 2) This environmental effect can have a genetic component. • 3) So, offspring traits (and fitness) affected by mom’s genes in 2 ways: • Direct genetic effects – inheritance of her genes • Indirect genetic effects – genetic component of her maternal effect.
A (indiv 1) Behavior (1) E (1) ψ Social E(1) Social E(2) ψ A (2) Behavior (2) E (2) IGEs – II. unrelated individuals Implications • Alters the genotype-phenotype relationship • Positive feedback loop increases rate of evolution E.g., aggressiveness
QTL = Quantitative trait locus A region of DNA that is statistically associated with a particular phenotypic trait. 1) Number of QTLs, distribution of QTL effects, interactions among QTLs (correlations, epistasis etc) – major parts of genetic architecture. Note: QG assumes many genes of small effect. QTL studies often show a few QTLs of moderate effect along with many other QTLs of small effect. 2) In principle, QTLs could lead to candidate genes – e.g., sequence the DNA at a QTL and compare to database for known gene sequences.
QTL mapping 1) Need a set of genetic markers (identified regions of variable DNA) spread across the genome. GOAL will be to identify statistical associations between a phenotype and one or more of these markers. 2) Use controlled crosses to create population with lots of variation in phenotypes and marker alleles, retaining tight linkage between marker and QTL. e.g., RIL = recombinant inbred lines • Cross 2 inbred strains – generates lots of genetic variation in F1 • Use the F1 to generate multiple inbred lines, little variation within each inbred line, lots of variation among lines. • Genotype the markers and measure phenotypes for each line. • Use statistical programs to assess statistical associations
Henderson et al (2004). QTL analysis of multiple behavioral measures of anxiety in mice. Behavior Genetics 34: 267-293 (prize winning paper) • 4 long-term selection lines of mice – 2 selected for high activity and 2 for low activity in the open-field assay. • H1 x L1 and H2 x L2 to generate F1s. F1 x F1 F2s, about 820 mice for each F2. Genotype markers assessed. • Each mouse run through battery of tests: open-field, light-dark box, elevated plus maze, mirror chamber, elevated square maze- with numerous behaviors measured in each assay. • Also, monitor home cage activity • Clustered behaviors into several main categories: Safe activity, risk activity, rearing, latency to act, defecation 6) Calculate LOD scores (log10 of odds of linked/odds of unlinked) of each marker with each behavioral category. LOD > 4.3 considered to be good evidence for a QTL
Genetic results 5 QTLs are associated with most of the measured behaviors– on 5 different chromosomes: 1, 4, 7, 15, 18 • Safe activity: chr 1 strong; 4, 7, 15, 18 significant • Risk activity: chr 7, 15 strong; 1, 4, 18 significant • Rearing: chr 15 strong, 4, 7, 18 significant • Latency: only chr 15 strong and significant • Defecation: chr 1 strong, otherwise, different QTLs than the other behaviors. • A few QTLs of moderate influence • Most of these influence multiple aspects of behavior. • Behavioral correlations explained by shared QTLs.
Pros and consWhich questions to study with which approach? • h2 and genetic r • Reaction norms and G x E • G x E correlations • Indirect genetic effects • QTLs MOLECULAR APPROACHES