SIMFOR habitat modeling in the Invermere
320 likes | 468 Vues
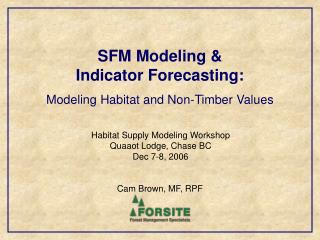
SIMFOR habitat modeling in the Invermere. Enhanced Forest Management Pilot Project. Eric Valdal, GIS Analyst, EFMPP Ralph Wells, Research Analyst, CACB - UBC. OBJECTIVES. 1. To evaluate habitat impacts of harvest scenarios in the Invermere EFMPP study area.

SIMFOR habitat modeling in the Invermere
E N D
Presentation Transcript
SIMFOR habitat modeling in the Invermere Enhanced Forest Management Pilot Project. Eric Valdal, GIS Analyst, EFMPP Ralph Wells, Research Analyst, CACB - UBC
OBJECTIVES 1. To evaluate habitat impacts of harvest scenarios in the Invermere EFMPP study area. 2. To evaluate habitat in the Pilot study area. 3. To develop quantitative approaches to habitat analysis for selected species.
Approaches • Identify species: Goshawk, CNB, songbirds. • Develop quantitative methods for habitat models. • Utilize existing databases for stand structure projections. • Incorporate natural disturbance in harvest runs.
Habitat Supply Modeling To examine the effects of forest harvesting on the availability of habitat attributes. Useful where strong linkages exist between habitat attributes and species (i.e. cavity nesting birds and snags). • Habitat Association Modeling Statistical approaches useful where linkages are less clear; can incorporate stand and landscape level information. Quantitative Approaches to Habitat Modeling:
SIMFOR Habitat Analysis Base Maps Habitat Attributes Species - Habitat Relationships Treatments: Harvest Schedule Natural Disturbance Maps Summary Data Field Evaluation GIS Processing GIS Processing Maps Tables, Figures
The Habitat Modeling Niche in theInvermere EFMPP Harvest Scenarios Habitat Impacts FSSIM Analysis. “Basecase” harvest scenario. Current management. Habitat Impacts determined by the Forest Ecosystem Specialist, MOE Invermere . A comparison of the habitat impacts resulting from the two management scenarios. “Strategy 98” harvest scenario. Based on “enhanced” forest management. Desired Management.
Habitat Impacts Determination Peter Holmes Invermere FES, MOE • Habitat Modeling Trends. • Goshawk • Cavity Nesters • Songbirds • Maps, Graphs over space and through time. Local knowledge
Habitat Modeling Inputs I Disturbance • Harvest Schedules • Fire (Alpine) • Pine Beetle • DRA Colours represent decade of disturbance. Harvest Schedule Operability Line Alpine Fire Operability Line
Modeling Inputs II (Goshawk Nesting Project) Data to form Species-Habitat Relationships. (Stand level) Data to track Habitat Attributes over a large area. (Strategic, i.e. LU, District) Literature Review • Utzig and Gaines 1997 Review of existing Goshawk research for attribute selection. Quantitative Nesting Inventory • Marlene Machmer refined the Lit. review attribute criteria,by locating and and assessing 16 nest sites. • Data from three other nest sites have been added. • Forest Cover Database • Cruise Database • TRIM
Scaling Up Attributes(Goshawk Nesting) Inventoried Stand Level Attributes Attributes Modeled • Very Large Trees • Large Trees • Crown Closure • Canopy Complexity • Slope • Proximity to Water Source • Aspect • Large Snags • CWD • Patch Sizes Assumptions • Very Large Trees • Structure • CWD • Snags • Slope • Aspect • Patch Size (GIS)
250 Fd good 200 Pl good/med 150 Stems/ha 100 50 0 DC 2 - 4 >20cm DBH 0 10 30 50 70 110 130 150 180 Years Goshawk Attributesas inserted into SIMFOR • Slope • static attribute map • Aspect • static attribute map • Structure • supply curves by AU • Very Large Trees (critical) • dynamic attribute maps (projected ages through time, with harvest disturbance considered).
Very Large Tree Attribute(Goshawk Nesting) • The “Very Large Tree” attribute was addressed in two parts: 1. Single Layer Stands 2. Multiple Layer Stands • This attribute was “scaled up” by determining which Age Classes (by Stand [AU]) had a sufficient number of trees >50cm dbh. to “qualify” as a candidate. This was done by analyzing the IFD Cruise database.
Very Large Tree Attribute Criteria: 50cm. Dbh and greater Good 20 stems\ha. plus Mod. 10-20 stems\ha. Low. 5-10 stems\ha. Analysis Units were chosen to qualify at the ageclass that they reached 10 stems per ha. Cruise database Analysis Stems >=50cm. Dbh per ha. Stems >=50cm. Dbh per ha. Stems >=50cm. Dbh per ha.
Large Tree Attribute - Multi Story Stands • Some nests have been discovered in young stands i.e. The Forest Cover Map says Ageclass 4. • These stands used for nesting (particularly in the IDF and MS) tend to have large vets which the goshawks are nesting in. • This over story tree layer can be mapped with the existing forest cover database. Premier Lake Forest Cover Age classes (rank 1)
Layer 2 ageclass (Vets) Layer 1 ageclass Premier Lake Premier Lake
Stand Dither by Ageclass and Crown Closure • Stands with vertical structure • can contribute to the large • tree attribute • Stands contribute when the • understory is at least 61 yrs and • the overstory is at least 101 yrs.* Premier Lake
Goshawk Nesting Results Mapping Spatial and Temporal Differences... Basecase Year 1 Basecase Year 40 Stork Creek
Goshawk Nesting Results • given assumptions, NOGO nesting habitat is increasing through time. • There may be spatial differences in NOGO habitat between the two harvest strategies.
Habitat Association I: Habitat Relationships - Songbirds • Regression models developed in collaboration with Kari Stuart-Smith for selected neo-tropical migrants (MS and ESSF zones). • e.g.: • ln(ocwa count) = -1.198 - 0.141(LCONOVER) + 0.0085(SHCOVER) – 0.0486 (HEIGHT) + 0.0088 (REGENDEC) – 0.0034(REGENCON) – 0.0066(REGENPL) + 0.202(REGENSP) • ln(wiwa count) = -2.776 + 0.0025(ELEV) + 0.0149 (ASPSLO) –0.0096 (ALLSNAGS) – 0.281(MNLAYERS) – 0.050 (HEIGHT)
Slope-Aspect Habitat Association II: Habitat Attributes
Year 1 Year 20 Abundance OCWA - MS: Strategy 98
Hardwood Habitat Attributes: Nesting (Year 1): Source: Forest Cover Data % Species fields
Lw snags (stems/ha) Lw potential nesting/foraging 60 50 40 30 Stems/ha Au 4 Lw G 20 Au 5 Lw M 10 Au 6 Lw P 0 0 50 100 150 200 Age Habitat Attributes: Nesting (Year 1): Western Larch - Potential Nesting / Foraging
Foraging (Year 1): DRA MPB
DRA model: ITG: Fd, Lw, Pl Code: 8415-15, 8315-15 (AGECLASS,HT_CLASS,STK_CLASS,CROWN_CL_CLASS, AND SITE INDEX) MPB model (Shore and Safranyik): S = P x A x D x L S - susceptibility P - percent susceptible pine BA A - age factor D - density factor L - location factor
Last Words I: • 1. Model predictions are hypotheses. • test of inventory to project structure • test of knowledge about habitat relationships • 2. Field verification is an essential next step. • 3.Strategic vs. Tactical applications: • Quantitative habitat evaluations (Strategic planning - i.e. TSR). • ID Patches important for habitat (Tactical - i.e. LU planning). • Confidence will improve as models are tested and refined.
Last Words II: Species - Habitat Relationships • research and data synthesis - appropriate for scaling up Habitat Attributes • stand level data - scaling issues from cruise to fip; inventory • limitations (i.e. cwd, understory vegetation). • stand structure implications of disturbance (i.e. MPB, DRA). Treatments • accurate spatial harvest modeling will sometimes be important. • cannot ignore natural disturbance. • Teamwork - biologists, GIS support, planners • setting objectives; getting results
Last Words III: Modeling Toolbox Relative Time Spent(i.e. Goshawk Modeling) • GIS • Arc\Info, Pamap • SIMFOR • Access relational database setup, maps • Generic Database • FoxPro, Access • Programming Tools • Perl, SQL • Statistical Tools • SAS “Scaling up” refers to the process of selecting indicator attributes to represent many related stand level attributes.
ACKNOWLEDGMENTS We gratefully acknowledge: Forest Renewal B.C. funding provided by the Invermere Forest District Enhanced Forest Management Pilot Project Greg Anderson for support of the project Fred Bunnell for support and helpful comments Russ Hendry for providing the harvest schedules Emile Begin for discussions on MPB and DRA modeling Arnold Moy and Susan Paczek of CACB for database development and assistance in model runs