Download
1 / 1
10 likes | 261 Vues
Agricultural drought analysis and famine early warning: FEWS NET land data assimilation system. Amy McNally 1 , Gregory Husak 1 , Shraddhanand Shukla 1 , Kristi Arsenault 2 , Chris Funk 3,1 , Christa Peters-Lidard 2 , James P. Verdin 3.

E N D
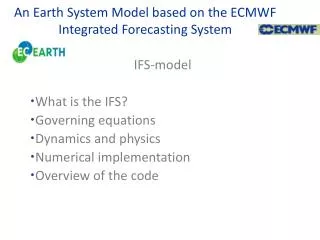
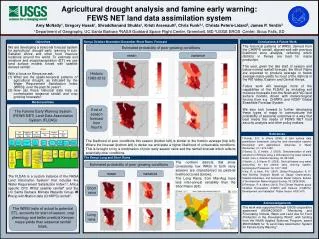
Agricultural drought analysis and famine early warning: FEWS NET land data assimilation system Amy McNally1, Gregory Husak1, ShraddhanandShukla1, Kristi Arsenault2, Chris Funk3,1, Christa Peters-Lidard2, James P. Verdin3 1Department of Geography, UC Santa Barbara 2NASA Goddard Space Flight Center, Greenbelt, MD 3USGS EROS Center, Sioux Falls, SD Objectives Conclusions & Future Work Kenya October-November-December Short Rains Forecast The historical patterns of WRSI, derived from the CHIRPS rainfall, aligned well with previous livelihood zone analysis, reflecting which districts in Kenya are best for maize production. This year, given the late start of season and below normal rainfall forecast, the Short Rains are expected to produce average or below average maize yields for most of the districts in the Rift Valley, Eastern and Central Kenya. Future work will leverage more of the capabilities of the FLDAS by including soil moisture forecasts from the Noah and VIC land surface models, driven with meteorological forcing from e.g. CHIRPS and NCEP Global Ensemble Forecast System. We also look forward to further developing these types of maps to communicate the probability of seasonal outcomes in a way that best meets the needs of FEWS NET food security analysts and other policy makers. Estimated probability of poor growing conditions We are developing a seasonal forecast system for agricultural drought early warning in sub-Saharan Africa and other food insecure locations around the world. To estimate soil moisture and evapotranspiration (ET) we use land surface models forced with satellite derived rainfall. With a focus on Kenya we ask: What are the spatio-temporal patterns of agricultural drought, as indicated by the Water Requirement Satisfaction Index (WRSI), over the past 30 years? How can these historical data help us contextualize seasonal rainfall and crop growing forecasts? mean variance Historic 1983-2012 Model and Data End of season forecast from Nov15 The Famine Early Warning System (FEWS NET) Land Data Assimilation System (FLDAS) References RFE2 CHIPRS WRSI VIC Crop Map, Rooting Depth 1-Kumar, S.V., & others (2008). A land surface data assimilation framework using the land information system: Description and applications. Advances in Water Resources, 31, 1419-1432. 2-Senay, G., & Verdin, J. (2003). Characterization of yield reduction in Ethiopia using a GIS-based crop water balance model. Can. J. Remoto Sensing, 29, 687-692 3-Verdin, J., & Klaver, R. (2002). Grid-cell-based crop water accounting for the famine early warning system. Hydrological Processes, 16, 1617-1630 4-Xie, P., & Arkin, P.A. (1997). Global Precipitation: A 17-Year Monthly Analysis Based on Gauge Observations, Satellite Estimates, and Numerical Model Outputs. Bulletin of the American Meteorological Society, 78, 2539-2558, 5-Peterson. P. & others (2013) The Climate Hazards group InfraRed Precipitation (CHIRP) with Stations (CHIRPS): Development and Validation” Poster Session: H33E-1417) The likelihood of poor conditions this season (bottom left) is similar to the historic average (top left). Where the forecast (bottom left) is darker we anticipate a higher likelihood of unfavorable conditions. This is brought on by a combination of poor early season rains and the rainfall forecast which reflects potentially drier conditions. The Kenya Long and Short Rains The northern districts that show consistently low WRSI in both rainy seasons are characterized as pastoral livelihood zones (below). The Long Rains, from Mar-Aug have less inter-annual variability than the Short Rains (left). Estimated probability of poor growing conditions variance mean The FLDAS is a custom instance of the NASA Land Information System1 that includes the Water Requirement Satisfaction Index2,3, Africa specific CPC RFE2 satellite rainfall4 and the UC Santa Barbara Climate Hazards Group IRPrecip with Station data (CHIRPS) rainfall5. Short rains Acknowledgements The WRSI (ratio of actual to potential ET), accounts for start-of-season, crop phenology and better predicts Kenyan maize yields than seasonal rainfall totals. This work was supported through USGS cooperative agreement #G09AC000001 “Monitoring and Forecasting Climate, Water and Land Use for Food Production in the Developing World”, with funding from the NASA Applied Sciences Program, award #NN10AN26I for "A Land Data Assimilation System for Famine Early Warning". Long rains