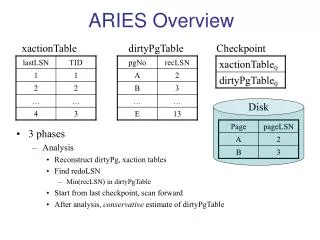
Disruption Specification in ARIES
Disruption Specification in ARIES. C. Kessel , PPPL ARIES Project Meeting, January 23-24, 2012, UCSD. Continuing the loading description for PFCs. divertor/heat nominal nominal transient off-normal transient

Disruption Specification in ARIES
E N D
Presentation Transcript
Disruption Specification in ARIES C. Kessel, PPPL ARIES Project Meeting, January 23-24, 2012, UCSD
Continuing the loading description for PFCs divertor/heat nominal nominal transient off-normal transient PSOL(rad+cond) ELMs disruption divertor/particle nominal nominal transient off-normal transient DT,He,Ar ELMs disruption FW/heat nominal nominal transient off-normal transient Prad,core ELMs disruption CX neutrals runaway electrons stationary core MARFE fast confinement loss stationary X-pt MARFE fast alpha particles FW/particle nominal nominal transient off-normal transient DT flux ELMs disruption CX flux runaway electrons fast confinement loss fast alpha particles
Disruption Basics • Major concerns from disruptions • Energy deposition on FW and divertor (melting and erosion) • Electromagnetic loads (induced eddy currents and halo currents) • Runaway electrons (local deposition of high energy e’s on FW) • For ARIES, a major disruption (MD) and a vertical displacement event disruption (VDE) are the scenarios we will address • Disruption phases • Predisrupt plasma stored energy loss (small for high βN plasmas), but VDEs undergo H-mode to L-mode transition when they hit first wall • Thermal quench (fast, ~ 1 ms) • Fast pressure drop causes a toroidal flux change leading to induced poloidal eddy currents • Fast energy pulse to divertor and FW (~ 1 ms) • VDE has plasma in contact with FW during thermal quench • Plasma current quench ( ~ 25 ms) • Radiative energy loss to FW, 50-100% to FW, with 0-20% conducted to divertor or FW • Drop in Ip induces eddy currents in structures • Halo current develops in later ½ to 1/3 of Ip drop • Runaway electron generation
For ARIES, vertical displacement events (VDE) and major disruptions (MD) are appropriate • VDE: • Plasma drifts vertically • Plasma contacts wall, has an H-L mode transition • Plasma continues to collapse into wall, when qedge ~ 1.5, thermal quench • Thermal quench is about 1-2 ms long, plasma loses its stored energy • Current quench begins as the cold plasma dissipates the plasma current, radiates magnetic energy • Halo currents are generated in the later half of Ip drop • Runaway electrons can also be generated in the Ip drop, which changes energy flow • MD: • Plasma has a sudden thermal quench in its normal operating position • Thermal quench causes all stored energy to be lost in 1-2 ms • The current quench follows this, and radiates magnetic energy • The plasma will move radially in response to the sudden pressure drop, and drift vertically as well, contacting the inboard FW • Halo current and runaway electrons can be generated in these disruptions
The amount of energy released in a thermal quench, is likely the same as the high performance plasma It is observed in experiments that the amount of stored energy in the plasma when it undergoes a thermal quench is actually lower than its full performance state The plasma has undergone some transitions already, before the thermal quench, which releases some of the stored energy, this goes to the divertor, but generally over a longer time-scales HOWEVER, for us with higher performance plasmas near beta limits, and VDE’s, the entire stored energy is available For ARIES we should assume all the stored energy will be released in the thermal quench The range is actually 65-100% For VDE’s the plasma loses about ½ its stored energy when it hits the FW preceding the thermal quench
Thermal quench time, roughly correlated with plasma volume ARIES ARIES plasma volume is about 440 m3 (for R=5.5m, a=1.375 m, κ=2.15) This gives about Δttq ~ 1.5-2.5 ms Variations within the same device can be large The rise phase of power to the divertor is ~ Δttq And the decay phase is 2-4 times longer….this is just like ELMs Decay phase Rise phase
The thermal quench time is not that easy to decipher due to complexity of the process Here is the total Te drop time (open circles), and the time for the final Te drop (closed circles) for various tokamaks….we still get about 0.6-4.0 ms range Te in plasma center Dα light in divertor JET results
Thermal quench and partitioning the power to PFCs For the disruptions we are concerned with, a small fraction of the released energy finds its way to the divertor, ~ 10-50% This infers that 50-90% of the energy goes to the first wall This is easy to understand for a VDE which hits the first wall before disrupting….although it also appears to be the case for ITB or high beta plasmas (MHD causes contact with the wall) It has been observed that up to 15% of the energy released can be in the form of radiation, with peaking factor of 3.5 Some magnetic energy is released on low energy disruptions There is a wide variation between JET (10-50%), D3D and ASDEX-U (50-100%) for the energy fraction going to the divertor
Further break the energy released in the thermal quench into that during the rise phase and that in the decay phase Approximately 25% of plasma energy released in thermal quench reaches PFCs in Δttq The remaining 75% reaches the PFCs over the 2-4 times Δttq time frame following the rise phase HOWEVER, because the energy density is so high, material damage is expected, and according to the experts we must consider the whole time that the heat flux is coming in….it is the time spent at this flux that is important Decay phase Rise phase
The deposition footprint in the divertor expands considerably during the thermal quench The deposition footprint during a thermal quench in the divertor is found to be about 5-10 times the normal steady power footprint Recall ELMs might not show any expansion The diverted plasmas show this trend, which does not appear as strong for limiter devices Toroidal peaking may be up to 2 for the divertor TEXTOR is a limiter device
Try some numbers for the thermal quench Plasma stored energy is ~ 510 MJ (for the VDE, this would about ½ this value) Assume 10-50% to divertor, 51-255 MJ Assume 50-90% to FW, 255-460 MJ, outboard only Assume 0-15% radiated to FW, 0-76.5 MJ, take 20% to inboard, 80% outboard Divertor intercepting area = 1.44 x 5-10 = 7.2-14.4 m2 FW intercepting area cond/conv (outboard only) = 287 m2 / 2 (peaking) = 144 m2 FW intercepting area for radiation = 157/3.5 (peaking) inboard, 287/3.5 (peaking) outboard = 44.9 m2 (IB) and 82 m2 (OB) Since the fluxes are so high as to damage the materials, the time over which they are above the damage thresholds is most important, so the whole pulse time will be used, ΔtTQdis = 3 x ΔtTQ (as opposed to only the rise time as used in ELM analysis, Loarte/Federici) Melting/ablation factor = ΔW / A / (ΔtTQdis)1/2 OR ΔT = ΔW x (2/k) x (α/π)1/2 / A / (ΔtTQdis)1/2 for square wave (Tillack) Divertor energy flux = 3.5-35 MJ/m2, over 1.5-2.5 ms, giving 41-530 MW/m2-s1/2 FW(cond/conv) energy flux = 1.8-3.2 MJ/m2, over 1.5-2.5 ms, giving 21-48 MW/m2-s1/2 FW(radiation) energy flux = 0-0.75 MJ/m2 (OB) and 0-0.34 MJ/m2 (IB), assume 2 ms, giving ~ 16.8 MW/m2-s1/2 (OB) and ~ 7.6 MW/m2-s1/2 (IB) >40 MW/m2-s1/2 beginmelting of W surface
Plasma current quench phase Tokamak disruption database • The current quench phase is initiated by the thermal quench, when the plasma temperature drops to very low values • Fastest Ip quench time, ~ 1.8 ms/m2 (from 100%-0% Ip), multiply this by plasma cross-sectional area πa2κ • For ARIES with a = 1.38 m and κ=2.15, this is ~ 25 ms for a linear Ip drop • OR about ~12 ms (about ½ the linear time) for an exponential Ip drop • This is also the timescale for conducted/convected/radiated power to PFCs • The current quench can turn into a runaway electron discharge before actually getting to 0 MA….we will discuss this later
During the current quench the magnetic energy in the plasma is mostly radiated away to the first wall The ohmic dissipation of the plasma current is very strong, particularly at low Te……ηj2, where η~ 1/Te3/2 Low temperature plasmas are very good radiators Radiated power levels are about 40-90% of the available magnetic energy…..1/2LintIp2, where Lint = μoRli/2….peaking factor in this phase is 1.5-2 For ARIES Wmag ~ 125 MJ (compared to ITER’s 350 MJ) Some of the magnetic energy is going to end up generating eddy currents in surrounding structures JET data No runaway electrons Final radiated power loss after runaway electrons Some energy can also end up as conducted or convected power to the FW
Runaway electron current quenches change the power deposition split • There is usually some drop in Ip during the current quench before runaway electrons are generated, here ~50% of the magnetic energy could be released • The termination after the runaway current releases about 10-25% more of the magnetic energy as radiation • The remaining magnetic energy is released as some combination of • runaway electron impact (their kinetic energy) • convection/conduction to the FW • eddy currents induced in structures Thermal Ip Runaway Ip Thermal Ip
Try some numbers for the current quench ARIES magnetic energy is Wmag~ 125 MJ Radiated power levels, with no runaway electrons, range from 40-90% give 50-113 MJ, assume 20% inboard and 80% outboard Assume remainder is cond/conv to FW (outboard only), 12-75 MJ FW intercepting area for radiated and cond/conv power = 157 / 2 (peaking) inboard, 287 / 2 (peaking) outboard, giving 79 m2 (IB) and 144 m2 (OB) Time scale is ~ 12-25 ms Energy densities are radiation < 0.68 MJ/m2 (OB), < 0.28 MJ/m2 (IB) Energy density for FW con/conv < 0.52 MJ/m2 These do not lead to significant loads compared to thermal quench Runaway electrons can be a problem!
Runaway electrons energy deposition We need to know the runaway current, estimate from Rosenbluth et al. Then we can estimate the magnetic energy in the runaway current phase, which is dominated by the runaway current in spite of a residual thermal plasma current In JET it is estimated that 20-60% of the runaway phase magnetic energy ends up as runaway kinetic energy The energy deposited on the FW is expected to scale as Ip,runaway2 Runaway electrons are lost to the FW often in a series of bursts, although single bursts have been seen Still trying to establish the estimate for this…. Runaway electron impacts JET IR measurements
Halo currents, flow from the cold plasma region into conducting structures making a poloidal circuit (jpolxBtor forces) Halo currents emerge in the later part of the current quench the maximum product Ihalo/Ip x TPF toroidal peaking factor is taken to be 0.5-0.7, although latest data is suggesting the lower values These are currents which form in the regions between the main plasma and the walls, the plasma is actually sharing current with this region because they are both low Te Halo currents follow field lines and impact surrounding structures