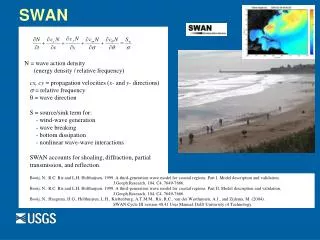
SWAN simulation
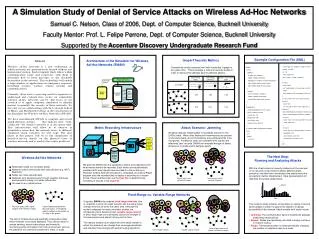
A Simulation Study of Denial of Service Attacks on Wireless Ad-Hoc Networks Samuel C. Nelson, Class of 2006, Dept. of Computer Science, Bucknell University Faculty Mentor: Prof. L. Felipe Perrone, Dept. of Computer Science, Bucknell University

SWAN simulation
E N D
Presentation Transcript
A Simulation Study of Denial of Service Attacks on Wireless Ad-Hoc Networks Samuel C. Nelson, Class of 2006, Dept. of Computer Science, Bucknell University Faculty Mentor: Prof. L. Felipe Perrone, Dept. of Computer Science, Bucknell University Supported by the Accenture Discovery Undergraduate Research Fund Architecture of the Simulator for Wireless Ad-Hoc Networks (SWAN) Graph-Theoretic Metrics Example Configuration File (DML) name "app" use "tstapp.sess-app-session" packet_size 512 iat 1.0 show_report true peer [ netid 1 hostid 2 iface 0 ] ] session [ name "aodv“ use "routing.aodv_sim.swan-aodv-session" netid 1 show_report true # show report at the end ] session [ name "net" use "net.ip-session"] session [ name "arp“ use "net.arp-session" show_report true ] interface [ id 0 # identification of network interface card netid 1 # identification of wireless network session [ name "mac" use "mac.mac-802-11-session" show_report true ] session [ name "phy" use "phy.phy-802-11-session" bandwidth 11e6 accumulative_noise true interference_threshold -111.0 ] ] ] ] ] model [ arena [ mobility [ # nodes are stationary model "mobility.stationary" deployment "random" # uniform distribution xdim 1500 # width of virtual space ydim 1500 # length of virtual space ] network [ netid 1 # wireless network 1 model "network.fixed-range" cutoff 350 # signal cutoff distance ] ] propagation [ model "propagation.friis-free-space" carrier_frequency 2.4e9 system_loss 1.0 temperature 290 noise_figure 10.0 ambient_noise_factor 0 ] # network node: configuration example host [ id 1 graph [ session [ Connectivity metrics measure how “well-connected” a graph isat a given time. This knowledge is critical to security studies inorder to measure the damage done by different attacks. Connectivity Index ConnectivityEfficiency Randic’s ConnectivityIndex Physical Process read terrain features Description Protocol Graph Terrain Model OS Model (DaSSF Runtime Kernel) memory time 0.44 1.00 4.26 run thread Host model read terrain features RF Channel Model 3.62 0.20 0.44 Metric Recording Infrastructure Attack Scenario: Jamming Wireless networks following 802.11 standards transmit on the2.4Ghz band. When other destructive transmissions are presenton the same band, all communications are jumbled and fail to berecognized. A malicious node can constantly emit signals andeffectively “jam” an area. SWAN can simulate this type of attack,allowing us to obtain useful damage reports. Metric Type File EPS SWAN simulation JPG metric values GIF Metric Data File Player Wireless Ad-Hoc Networks Recorder The Next Step:Running and Analyzing Attacks We gave the SWAN user the capability to define at configuration time what metrics need to be recorded. Each metric can be periodically sampled (at its own interval) and recorded to a file on disk by a Recorder module. After the simulation is completed, an external Playerprogram uses the recorded data to display it according to a chosen format. Player and Recorder use the Type File to determine the formatting of records in the Data File. • Networked nodes run on battery power. • Network nodes communicate with radio devices (e.g. Wi-Fi, Bluetooth). • Nodes can move around freely. • Networks form spontaneously through neighbor discovery and automatic routing: no human intervention. • No need for any infrastructure. With the infrastructure for security studies built, the next partof our research study will be to design different attackscenarios, simulate them, and analyze the results using theconnectivity metrics implemented. Data representation willresemble the sample graph below: Normal area and itsconnectivity graph. Jammed area and itsconnectivity graph. Attack Connectivity Fixed-Range vs. Variable-Range Networks Time Originally, SWAN only modeled fixed-range networks, that is, networks in which all nodes transmit with the same signal strength and thus all cover the same area. Although this model is adequate for many simulation studies, we introduced a more flexible model: variable-range network, in which each node can individually choose the strength of its transmissions and adjust it at any point in time. This feature enables us to experiment with attack models in which the jammer(s) can change their coverage periodically and interfere more strongly with packet routing algorithms. This research study primarily concentrates on denial of service(DoS) attacks in which the goal of the attack is to disruptaccessibility to the network. Attack models we’ll study include: Physical layout (with signal ranges) of the wireless nodes. Graph representation of the physical layout. Overlapping regions indicate a connection (or an edge in the graph). • Jamming: The communication band is flooded with garbage disallowing transmissions. • Reboot: Nodes are periodically rebooted, causing confusion in network routing. • Range: Transmission power is varied periodically changing the number of neighbors seen by a node. The lack of infrastructure and automatic configuration allow these networks to be easily deployed. They can be helpful in remote sensing, where nodes obtain and forward to monitoring points information from their environment, such as the presence of a chemical contaminant, video, or audio. Fixed ranged network withjammers of different ranges. Fixed ranged network. Variable ranged network.