
Uploaded by
kyros
1 SLIDES
141 VUES
10LIKES
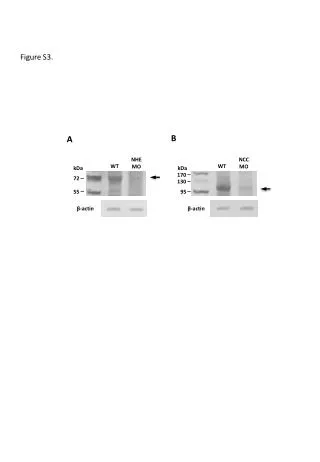
Analysis of NHE and NCC Protein Expression Levels in Wild-Type Samples
DESCRIPTION
This figure (Figure S3B) displays the molecular weights of NHE and NCC proteins, highlighting their expression levels in wild-type (WT) samples. The protein markers show bands at approximately 170 kDa, 130 kDa, 95 kDa, and 55 kDa alongside β-actin as a loading control. The data underscores the quantitative differences in proteins being analyzed, suggesting potential physiological implications.
Download
1 / 1
Télécharger la présentation 
Analysis of NHE and NCC Protein Expression Levels in Wild-Type Samples
An Image/Link below is provided (as is) to download presentation
Download Policy: Content on the Website is provided to you AS IS for your information and personal use and may not be sold / licensed / shared on other websites without getting consent from its author.
Content is provided to you AS IS for your information and personal use only.
Download presentation by click this link.
While downloading, if for some reason you are not able to download a presentation, the publisher may have deleted the file from their server.
During download, if you can't get a presentation, the file might be deleted by the publisher.
E N D


More Related