Discovery and Reconstruction of Unannotated Transcripts Using Expectation Maximization
This paper presents DRUT, a method for discovering and reconstructing unannotated transcripts from transcriptomic data. The process begins with a set of transcripts and their associated read frequencies. By employing the Expectation Maximization (EM) algorithm, we estimate the frequencies of unannotated transcripts. The method incorporates initial uniform frequencies, computes expected read samples, and adjusts for the misalignment of reads due to genotyping errors and other gaps. Our evaluation on human genome data demonstrates the effectiveness of DRUT in assembling missing transcripts, particularly in genes with low transcript counts.

Discovery and Reconstruction of Unannotated Transcripts Using Expectation Maximization
E N D
Presentation Transcript
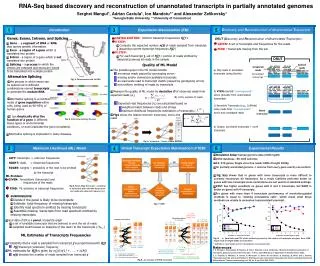
Discovery and Reconstruction of UnannotatedTranscripts Introduction Expectation Maximization (EM) DRUT (Discovery and Reconstruction of UnannotatedTranscripts): GIVEN:A set of transcripts and frequencies for the reads. FIND : Transcripts missing from the set. Genes, Exons, Introns, and Splicing • INITIALIZATION: Uniform transcript frequencies f(j) ‘s • E STEP: • Compute the expected number n(j)of reads sampled from transcript j (assuming current transcript frequencysf(j) ) • M STEP: • For each transcript j, set of f(j) = portion of reads emitted by transcript j among all reads in the sample Gene - asegmentofDNA or RNA that carries genetic information. Exon - a region of a gene which is translated into protein Intron- a region of a gene which is not translated into protein Splicing – a process in which the introns are removed and exons are joined to be translated into a single protein Quality of ML Model a) Map reads to annotated transcripts (using Bowtie) b) VTEM: Identify “overexpressed” exons (possibly from unannotated transcripts) c) Assemble Transcripts (e.g., Cufflinks) using reads from “overexpressed” exons and unmapped reads d) Output: annotated transcripts + novel transcripts • The possible gaps in the ML model include: • erroneous reads caused by genotyping errors • missing and/or chimerical candidate transcripts • an inaccurate read to transcript match (caused by genotyping errors) • non-uniform emitting of reads by transcripts • Measure the quality of ML model by deviation D of observed reads from expected reads(ej) • Expected read frequencies (ej) are calculated based on • weighted match between reads and strings • maximum likelihood frequencies estimations of transcripts ( ) Alternative Splicing Fig. 1. Chromosome with its DNA • the process in which exons can be spliced out in different combinations named transcripts to generate the mature RNA. • Alternative splicing is a common mode of gene regulation within cells, being used by 90–95% of human genes. • It can drastically alter the function of a gene in different tissue types or environmental |R| is the number of reads Fig4 shows the relation between transcripts, exons and reads Fig. 2. Alternative Splicing Process conditions, or even inactivate the gene completely. Alternative splicing is implicated in many diseases. Fig. 4. Transcripts – Exons –Reads Relation. Virtual Transcript Expectation Maximization (VTEM) Maximum Likelihood (ML) Model Experimental Results • Simulation Setup: human genome data (UCSC hg18) • UCSC database - 66, 803 isoforms • 19, 372 genes, Single error-free reads: 60M of length 100bp • for partially annotated genome -> remove from every gene exactly one isoform • Fig. 9(a) shows that in genes with more transcripts is more difficult to correctly reconstruct all transcripts. As a result Cufflinks performs better on genes with few transcripts since annotations are not used in it standard settings. • DRUT has higher sensitivity on genes with 2 and 3 transcripts, but RABT is better on genes with 4 transcripts. • For genes with more than 4 transcripts performance of annotation-guided methods is equal to ”existing annotations ratio”, which mean what these methods are unable to reconstruct unannotated transcript.. • LEFT: transcripts -> unknown frequencies • RIGHT: reads -> Observed frequencies • EDGES: weights ~ probability of the read to be emitted • by the transcript ML Problem: GIVEN: Annotations (transcripts) and frequencies of the reads. Fig 3. Panel: Bipartite Graph - consisting of transcripts with unknown frequencies and reads with observed frequency (oj) FIND:ML estimate of transcript frequencies • SUBPROBLEMS: • Decide if the panel is likely to be incomplete • Estimate total frequency of missing transcripts • Identify read spectrum emitted by missing transcripts • Assemble missing transcripts from read spectrum emitted by missing transcripts Fig. 7. VTEM • Input data of EM is a panel: a bipartite graph • a set of candidate transcripts that are believed to emit the set of reads • weighted match based on mapping of the read i to the transcripts j (hTj, i) ML Estimates of Transcripts Frequencies Fig. 9. a) Sensitivity and PPV of the methods grouped by the number of transcripts per gene. Here, 60M single reads of length 100bp are simulated • Probability that a read is sampled from transcript j is proportional with f(j) • f(j) transcript (unknown) frequency • ML estimates for f(j) is given by n(j)/(n(1) + . . . + n(N)) • n(j) denotes the number of reads sampled from transcript j * Cufflinks is a well known tool for transcriptome reconstruction [2]. References 1. S. Mangul, I. Astrovskaya, M. Nicolae, B. Tork, I. Mandoiu, and A. Zelikovsky, “Maximum likelihood estimation of incomplete genomic spectrum from hts data,” in Proc. 11th Workshop on Algorithms in Bioinformatics, 2011. 2. C. Trapnell, B. Williams, G. Pertea, A. Mortazavi, G. Kwan, M. van Baren, S. Salzberg, B. Wold, and L. Pachter, “Transcript assembly and quantification by RNA-Seq reveals unannotated transcripts and isoform switching during cell differentiation.” Nature biotechnology, vol. 28, no. 5, pp. 511–515, 2010. Fig 8. An example of VTEM estimation