Expectation-Maximization (EM) Algorithm
Expectation-Maximization (EM) Algorithm. Md. Rezaul Karim Professor Department of Statistics University of Rajshahi Bangladesh September 21, 2012. Basic Concept (1). EM algorithm stands for “ Expectation- Maximization ” algorithm

Expectation-Maximization (EM) Algorithm
E N D
Presentation Transcript
Expectation-Maximization (EM) Algorithm Md. Rezaul Karim Professor Department of StatisticsUniversity of Rajshahi Bangladesh September 21, 2012
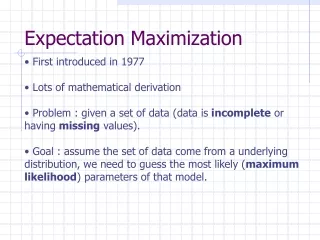
Basic Concept (1) • EM algorithm stands for “Expectation- Maximization” algorithm • A parameter estimation method: it falls into the general framework of maximum - likelihood estimation (MLE) • The general form was given in Dempster, Laird, and Rubin (1977), although essence of the algorithm appeared previously in various forms. Dr. M. R. Karim, Stats, R.U.
Basic Concept (2) • The EM algorithm is a broadly applicable iterative procedure for computing maximum likelihood estimates in problems with incomplete data. • The EM algorithm consists of two conceptually distinct steps at each iteration: • the Expectation or E-step and • the Maximization or M-step • Details can be found: Hartley (1958), Dempster et al. (1977), Little and Rubin (1987) and McLachlan and Krishnan (1997) Dr. M. R. Karim, Stats, R.U.
Formulation of the EM Algorithm (1) • Y = (Yobs, Ymis) • Complete data Y (e.g., what we’d like to have!) • Observed data Yobs(e.g., what we have) • Missing data Ymis(e.g., incomplete/unobserved) Dr. M. R. Karim, Stats, R.U.
Formulation of the EM Algorithm (2) Dr. M. R. Karim, Stats, R.U.
Formulation of the EM Algorithm (3) Dr. M. R. Karim, Stats, R.U.
initialguess E step Guess of unknown parameters M step Formulation of the EM Algorithm (4) Guess of unknown/ hidden data structure and Q function Observed data structure Dr. M. R. Karim, Stats, R.U.
Formulation of the EM Algorithm (5) Dr. M. R. Karim, Stats, R.U.
Formulation of the EM Algorithm (6) Dr. M. R. Karim, Stats, R.U.
Formulation of the EM Algorithm (7) Dr. M. R. Karim, Stats, R.U.
Formulation of the EM Algorithm (8) Dr. M. R. Karim, Stats, R.U.
Multinomial Example (1) Observed data Probability Dr. M. R. Karim, Stats, R.U. 12
Multinomial Example (2) Dr. M. R. Karim, Stats, R.U. 13
Multinomial Example (3) Dr. M. R. Karim, Stats, R.U. 14
Multinomial Example (4) Observed data Missing data Probability Dr. M. R. Karim, Stats, R.U. 15
Multinomial Example (5) Dr. M. R. Karim, Stats, R.U.
Multinomial Example (6) y1=125 y11 y12 1/2 θ/4 Dr. M. R. Karim, Stats, R.U. 17
Multinomial Example (7) Dr. M. R. Karim, Stats, R.U. 18
Multinomial Example (8) Dr. M. R. Karim, Stats, R.U. 19
Flowchart for EM Algorithm No Yes Dr. M. R. Karim, Stats, R.U. 20
R function for the Example: (1) (y1, y2, y3, y4 are the observed frequencies) EM.Algo = function(y1, y2, y3, y4, tol, start0) { n = y1+y2+y3+y4; theta.current = start0; theta.last = 0; theta = theta.current; while (abs(theta.last - theta) > tol ){ y12 = E.step(theta.current, y1) theta = M.step(y12, y2, y3, y4, n) theta.last = theta.current theta.current = theta log.lik = y1*log(2+theta.current) +(y2+y3)*log(1-theta.current)+ y4*log(theta.current) cat(c(theta.current, log.lik), '\n') } } Dr. M. R. Karim, Stats, R.U. 21
R function for the Example (2) M.step = function(y12, y2, y3, y4, n){ return((y12+y4)/(y12+y2+y3+y4)) } E.step = function(theta.current, y1){ y12 = y1*(theta.current/4)/(0.5+theta.current/4); return(c(y12)) } # Results: EM.Algo(125, 18, 20, 34, 10^(-7), 0.50) Dr. M. R. Karim, Stats, R.U. 22
R function for the Example (3) Dr. M. R. Karim, Stats, R.U. 23
Monte Carlo EM (1) • In an EM algorithm, the E-step may be difficult to implement because of difficulty in computing the expectation of log likelihood. • Wei and Tanner (1990a, 1990b) suggest a Monte Carlo approach by simulating the missing data Z from the conditional distribution k(z | y, θ(k)) on the E-step of the (k + 1)thiteration Dr. M. R. Karim, Stats, R.U.
Monte Carlo EM (2) • Then maximizing the approximate conditional expectation of the complete-data log likelihood • The limiting form of this as m tends to ∞ is the actual Q(θ; θ(k)) Dr. M. R. Karim, Stats, R.U.
Monte Carlo EM (3) • Application of MCEM in the previous example: • A Monte Carlo EM solution would replace the expectation • with the empirical average • where zj are simulated from a binomial distribution with size y1 and probability Dr. M. R. Karim, Stats, R.U.
Monte Carlo EM (4) • Application of MCEM in the previous example: • The R code for the E-step becomes • E.step= function(theta.current, y1){ • bprob = (theta.current/4)/(0.5+theta.current/4) • zm = rbinom(10000, y1, bprob) • y12 = sum(zm)/10000 • return(c(y12)) • } Dr. M. R. Karim, Stats, R.U.
Applications of EM algorithm (1) • EM algorithm is frequently used for – • Data clustering (the assignment of a set of observations into subsets, called clusters, so that observations in the same cluster are similar in some sense) used in many fields, including machine learning, computer vision, data mining, pattern recognition, image analysis, information retrieval, and bioinformatics • Natural language processing (NLP is a field of computer science and linguistics concerned with the interactions between computers and human (natural) languages) Dr. M. R. Karim, Stats, R.U.
Applications of EM algorithm (2) • Psychometrics (the field of study concerned with the theory and technique of educational and psychological measurement, which includes the measurement of knowledge, abilities, attitudes, and personality traits.) • Medical image reconstruction, especially in positron emission tomography (PET) and single photon emission computed tomography (SPECT) Dr. M. R. Karim, Stats, R.U.
Applications of EM algorithm (3) • More applications regarding data analysis examples are – • Multivariate Data with Missing Values • Example: Bivariate Normal Data with Missing Values • Least Squares with Missing Data • Example: Linear Regression with Missing Dependent Values • Example: Missing Values in a Latin Square Design • Example: Multinomial with Complex Cell Structure • Example: Analysis of PET and SPECT Data • Example: Mixture distributions • Example: Grouped, Censored and Truncated Data • Example: Grouped Log Normal Data • Example: Lifetime distributions for censored data Dr. M. R. Karim, Stats, R.U.
Advantages of EM algorithm (1) • The EM algorithm is numerically stable, with each EM iteration increasing the likelihood • Under fairly general conditions, the EM algorithm has reliable global convergence (depends on initial value and likelihood!). Convergence is nearly always to a local maximizer. • The EM algorithm is typically easily implemented, because it relies on complete data computations • The EM algorithm is generally easy to program, since no evaluation of the likelihood nor its derivatives is involved Dr. M. R. Karim, Stats, R.U.
Advantages of EM algorithm (2) • The EM algorithm requires small storage space and can generally be carried out on a small computer (it does not have to store the information matrix nor its inverse at any iteration). • The M-step can often be carried out using standard statistical packages in situations where the complete-data MLE’s do not exist in closed form. • By watching the monotone increase in likelihood over iterations, it is easy to monitor convergence and programming errors. • The EM algorithm can be used to provide estimated values of the “missing” data. Dr. M. R. Karim, Stats, R.U.
Criticisms of EM algorithm • Unlike the Fisher’s scoring method, it does not have an inbuilt procedure for producing an estimate of the covariance matrix of the parameter estimates. • The EM algorithm may converge slowly even in some seemingly innocuous problems and in problems where there is too much ‘incomplete information’. • The EM algorithm like the Newton-type methods does not guarantee convergence to the global maximum when there are multiple maxima (in this case, the estimate obtained depends upon the initial value). • In some problems, the E-step may be analytically intractable, although in such situations there is the possibility of effecting it via a Monte Carlo approach. Dr. M. R. Karim, Stats, R.U.
References (1) Dempster AP, Laird NM, Rubin, DB (1977) Maximum likelihood from incomplete data via the EM algorithm (with discussion). J Royal Statist Soc - B 39:1–38 Hartley HQ (1958) Maximum likelihood estimation from incomplete data. Biometrics 14:174-194 Little RJA, Rubin DB (1987) Statistical Analysis with Missing Data. John Wiley & Sons, Inc., New York Louis TA (1982) Finding the observed information matrix when using the EM algorithm. J Royal Statist Soc - B 44:226–233 McLachlan GJ, Krishnan T (1997) The EM Algorithm and Extensions. John Wiley & Sons, Inc., New York Dr. M. R. Karim, Stats, R.U.
References (2) Meng XL, Rubin DB (1991) Using EM to obtain asymptotic variance-covariance matrices: the SEM algorithm. J Am Statist Assoc 86:899-909 Oakes D (1999) Direct calculation of the information matrix via the EM algorithm. J Royal Statist Soc - B 61:479-482 Rao CR (1972) Linear Statistical Inference and its Applications. John Wiley & Sons, Inc., New York Redner RA, Walker HF (1984) Mixture densities, maximum likelihood and the EM algorithm. SIAM Rev 26:195-239 Dr. M. R. Karim, Stats, R.U.
References (3) 10. Wei, G.C.G. and Tanner, M.A. (1990a). A Monte Carlo implementation of the EM algorithm and the poor man’s data augmentation algorithms. Journal of the American Statistical Association 85, 699-704. 11. Wei, G.C.G. and Tanner, M.A. (1990b). Posterior computations for censored regression data. Journal of the American Statistical Association 85, 829-839. 12. Wu CFJ (1983) On the convergence properties of the EM algorithm. Ann Statist 11:95-103 Dr. M. R. Karim, Stats, R.U.
Thank You Dr. M. R. Karim, Stats, R.U.