Download
1 / 27
290 likes | 339 Vues
Learn about Förster Resonance Energy Transfer (FRET) theory, milestones, Förster radius, energy transfer efficiency, and homo energy transfer for biomedical engineering applications. Explore FRET efficiency calculation, distance dependence, and intensity vs. kinetic-based approaches. Discover how FRET affects photobleaching and deexcitation processes in fluorescent proteins.

E N D
CZECH TECHNICAL UNIVERSITY IN PRAGUE FACULTY OF BIOMEDICAL ENGINEERING Förster Energy Transfer Excimer Fluorescence Fluorescent Proteins Martin Hof, Radek Macháň
Förster Resonance Energy Transfer - FRET D* A* FRET D A A fluorophore called donor (D) absorbs a photon and gets to its excited state (D* - typically lowest vibrational level of S1 state) If the energies of deexcitation processes of D* (such as fluorescence) match excitation energies of another molecule (acceptor A) in its vicinity, that means an overlap between emission spectrum of D and excitation spectrum of A, a radiationless energy transfer between D* and A can occur resulting in D and A*. Acceptor can then emit fluorescence (if it is fluorescent).
Milestones in the theory of FRET 1918 J. Perrin proposed the mechanism of resonance energy transfer 1922 G. Carioand J. Franck demonstrate that excitation of a mixture of mercury and thallium atomic vapors with 254nm (the mercury resonance line) also displayed thallium (sensitized) emission at 535nm. 1928 H. Kallmannand F. London developed the quantum theory of resonance energy transfer between various atoms in the gas phase. The dipole-dipole interaction and the parameter R0are used for the first time • 1932 F. Perrin published a quantum mechanical theory of energy transfer between molecules of the same specie in solution. Qualitative discussion of the effect of the spectral overlap between the emission spectrum of the donor and the absorption spectrum of the acceptor • 1946-1949 T. Försterdevelop the first quantitative theory of molecular resonance energy transfer
Basic properties ofFRET D* A* FRET D A The interaction is of dipole nature and depends on the distanceR of the molecules and the orientation of their transition dipoles The rate constant kET of FRET: tD is the lifetime of the donor in the absence of acceptor and R0 is a constant for the donor-acceptor pair – Förster radius
Förster radius n is the refractive index of the medium, QYD is the quantum yield of donor, J is normalized overlap integral of donor and acceptor spectra and k describes orientation of the dipoles fD(l) eA(l) D A DPH Tryptophan
Förster radius fET D fA the limits of k2 are from 0 to 4. If the molecules undergo fast isotropic movement (dynamic averaging) k2 = 2/3 fD A R Dynamic averaging (k2 = 2/3) is usually assumed in FRET analysis and in tabulated values of R0.
Förster radius - examples Some typical donor-acceptor pairs commonly used in structural mapping of proteins, and their values of R0:
Energy transfer efficiency (E) Where kET is the rate of energy transfer and ki of all other deactivation processes. Experimentally, E can be calculated from the fluorescence lifetimes or intensities of the donor determined in absence and presence of the acceptor. or
1 0.75 0.5 Efficiency of transfer 0.25 0 0 20 40 60 80 100 Distance in Angstrom The distance dependence of the energy transfer efficiency (E) Where R is the distance separating the centers of the donor and acceptor fluorophores, R0 is the Förster radius. The efficiency of transfer varies with the inverse sixth power of the distance. R0 in this example was set to 40 Å. When the E is 50%, R = R0 Distances can generally be measured between ~0.5 R0 and ~1.5R0
Homo energy transfer FRET D A Energy transfer between molecules of the same fluorophore fluorescein There exists en overlap between the excitation and emission spectrum of a fluorophore Homo energy transfer is responsible for: self-quenching of fluorophores at high concentration decrease in anisotropy of fluorescence at high fluorophore concentrations (Gaviola and Prigsham 1924)
Determination of FRET efficiency • Intensity based: • Sensitized emission of the acceptor (provided it is fluorescent) • Decrease in intensity (quenching) of donor fluorescence The main problem of intensity based approaches is the sensitivity to donor and acceptor concentration • Kinetic based: • Decrease in lifetime (quenching) of donor fluorescence • Fluorescence decay of acceptor - It contains a rise in the initial phase corresponding to the kinetics of donor deexcitation by FRET (a component with “negative amplitude” in the fitted decay) • Kinetics of donor photobleaching The use of donor fluorescence is usually preferred, because the acceptor is usually to some extent excitable by the excitation wavelength of the donor – only a part of acceptor fluorescence is a result of FRET
Photobleaching of donor Photobleaching is a decrease in fluorescence intensity due to permanent inactivation of the fluorophores. It is usually caused by excited state reactions of the fluorophore in triplet state (for example with oxygen). Photobleaching is observed mainly at high excitation intensities when a significant fraction of molecules undergoes intersystem crossing. FRET represents an additional deexcitation channel and, thus decreases the probability of intersystem crossing and photobleaching. The decrease of intensity due to photobleaching is, therefore, slower where tPB is the intensity decay time due to photobleaching (I ~ exp(-t/tPB)) Photobleaching measurement is not sensitive to concentration and it does not require high temporal resolution – steady-state instrumentation)
FRET and distance measurements • FRET can be used to obtain structural maps of complex biological structures, primarily proteins orother macromolecular assemblies. • Measurements of energy transfer can provide intra- or intermolecular distances forproteins and their ligands in the range of 10-100 Å. • FRET can detect change in distance (1-2Å) between loci in proteins, hence it is a sensitivemeasure of conformational changes. • The donor and acceptor must be within 0.5 R0 -1.5 R0 from each other. • These measurements give the average distance between the two fluorophores. Whenmeasuring a change in distance, the result gives no indication of which fluorophore moves. • Experiments can be done with different donor-acceptor pairs. If the same distance is obtained, the result is very likely correct. • Quantitative analysis is restricted to the caseswhere only a few donors and acceptors are present
FRET concepts in protein science FRET between adonor and acceptor, each attached to a different protein,reports protein–protein interaction. Twofluorophores are attached to the same protein, where changes indistance between them reflect alterations in protein conformation,which in turn indicates ligand binding. Abrogation of intramolecular FRET can be used to indicate cleavage. A protein orantibody fragment (blue) binds only to the activated state of theprotein. The antibody fragment bears a dye which undergoes FRETwhen it is brought in close proximity to the dye on the protein. Insome examples, the domain is part of the same polypeptide chain asthe protein (dashed line).
Fluorophores for FRET in proteins Synthetic organic dyes (BODIPY, Dansyl, AEDANS, …) attached to the protein for example via amine groups (N-terminus, lysine) or via sulfhydryl groups (cysteine) Aromatic amino acid residues (Trp, Tyr, Phe). Possible FRET pairs are for example: Tyr – Trp or Phe - Tyr Fluorescent proteins (GFP, mCherry, …) are expressed in some organisms and can be genetically encoded to be expressed at desired locations of other proteins of other organisms. Mutations allow expressions of proteins of various spectral characteristics of fluorescence. FRET pairs
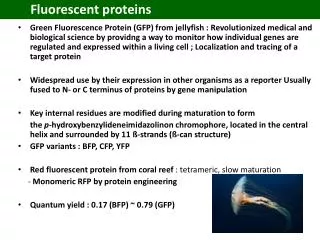
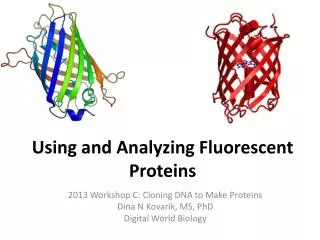
Green Fluorescent Protein (GFP) • Appears in sea organisms, Structure of GFP of jelly fish Aequorea victoria is know (1996) • 13 ß-sheets forming the ß-barrel • an a-helix inside the ß-barrel and a heterocyclic chromophor
in vivo excitation of GFP • Attack increases cellular Ca2+-concentration • Calcium binds to Aequorin • CO2 is released • Energy of excited Aequorin is transferred to GFP • GFP fluoresces
Formation of the Chromophore • formed by AS 65-67: Ser-Tyr-Gly • p-Hydroxyben-zyliden-imidazolidon • Isolated chromophore is not fluorescent folding cyclization G Y -H20 S
Fluorescence and Absorption (Wild-Type) • Abs. at 395 and 475 nm • Fluorescence at 509 nm • Fluorescence almost independent on lex
Förster-Cycle • A type of excited state reaction • Phenols are not acid in the S1-state • fs-spectroscopy: after 395 nm excitation, red-shift of fluorescence to 509nm during 10 ps
Mutations lead to 6 classes of FP • Class 1: Wild–type • Class2: Phenol-anion • Class 3: neutral Phenol in S0 EGFP t203i
Mutations lead to 6 classes of FP • Class 4 : - interactionyellow emission • Class 5 : Trp replaces Phenol cyan em. • Class 3: Imidazole replaces Trp blue em. YFP CFP BFP
Cameleon proteins – FP based biosensors E1 A biosensor for intra-cellularfree Ca2+. CFP and YFP are coupled through a Ca2+-binding protein calmodulin, which undergoes a dramatic structural change upon Ca2+ binding. The juxtaposition of FP results in FRET – CFP is donor and YFP acceptor. donor excitation at 440 nm Fluorescence emission in nm CFP YFP Truong et al. Nat Struct Biol, 8: 1069
Excimer fluorescence Excimer stands for excited dimer. The excimer has a different spectrum than the monomer – red shifted. A typical excimer forming fluorophore is pyrene (Förster 1954) M* + M → (MM)* • 2 mM (Argon) • 2 mM (air) • 0.5 mM (Argon) • 2 M (Argon – to remove oxygen) Pyrene in ethanol Note: If an excited complex of two different molecules is formed, it should be called exciplex, however even then the term excimer is often used (some excimer lasers)
E2 Pyrene excimer fluorescence Application: An assay for membrane fusion. Fusion results in dilution of pyrene in the membrane → decrease in the ration of excimer/monomer fluorescence intensity
Pyrene excimer and lipid diffusion in bilayers kE cM – monomersurface concentration M* + M → (MM)* kE = 2p D Pyrene excimer formation can be used to determine diffusion coefficient (D) of lipids in bilayers of vesicles (using lipids labelled with pyrene) Excimer formation competes with fluorescence of monomer and non-radiative deexcitation of monomer monomer fluorescence: excimer fluorescence: constant for a fluorophore, ≈ 10 for pyrene Determination of D via kE
Acknowledgement The course was inspired by courses of: Prof. David M. Jameson, Ph.D. Prof. RNDr. Jaromír Plášek, Csc. Prof. William Reusch Financial support from the grant: FRVŠ 33/119970