Download
1 / 18
180 likes | 315 Vues
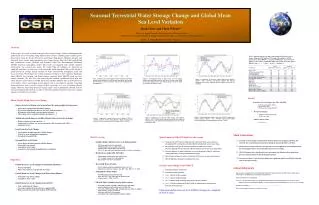
Observational evidence for volcanic impact on sea level and the global water cycle. Aslak Grinsted 1 , J. C. Moore 1,2 , S. Jevrejeva 3. 1. Arctic Centre, University of Lapland, Finland 2. Thule Institute, University of Oulu, Finland 3. PSMSL, Proudman Oceanographic Laboratory, Liverpool, UK.

E N D
Observational evidence for volcanic impact on sea level and the global water cycle Aslak Grinsted1, J. C. Moore1,2, S. Jevrejeva3 1. Arctic Centre, University of Lapland, Finland 2. Thule Institute, University of Oulu, Finland 3. PSMSL, Proudman Oceanographic Laboratory, Liverpool, UK
Outline • Motivation • Objectives • Data • Approach • Results • Conclusion
Motivation Volcanoes and Climate • Major volcanic eruptions can inject scattering aerosol into the stratosphere and thus impose a significant radiative cooling of the atmosphere.
Volcanoes and Climate Source: Robock (2000) Volcanic eruptions and climate. Rev. Geophys.
Volcanoes and changes in ocean heat content From Hansen et al., 2002, JGR Gleckler et al. Nature 2005 Short term effect Lasting effect
Models of volcanic impact on sea level Major volcanic eruption ▼Cooling of the world oceans ▼ Densification ▼ Sea level drop Nature, 2005
Nature 2005 Observational verification? ? Can we quantify the impact of volcanic eruptions using observations?
Objective • Estimate the effect of volcanic eruptions on observational sea level.
Data Global sea level (GSL) reconstruction (1807-2003) • RLR sea level data from PSMSL • (1023 stations) • GIA corrections from Peltier (2001) • SLP corrections • 12 regions Location of 1023 tide gauges included in this study. Jevrejeva et al., Nonlinear trends and multi-year cycle in sea level records. Journal of Geophysical Research, 111, 2005JC003229, 2006. Data: www.pol.ac.uk/psmsl/author_archive/jevrejeva_et_al._jgr.html
Regional average Individual tide gauge records Virtual station spatial stacking Binomial tree to illustrate the ‘virtual station’ stacking method. Top-node represents the regional average, bottom nodes the tide gauge records, and rest of nodes are virtual stations.
Global sea level (GSL) reconstruction (1807-2003) Jevrejeva et al., Nonlinear trends and multi-year cycle in sea level records. Journal of Geophysical Research, 111, 2005JC003229, 2006. Data: www.pol.ac.uk/psmsl/author_archive/jevrejeva_et_al._jgr.html
Eruptions causing the largest radiative forcing since 1890 5 largest eruptions have been modelled to have an impact on sea level. We focus on these.
Results Average impact of 5 major volcanoes on detrended GSL as observed in tide gauge records (solid black curve). Coloured lines show detrended GSL around the individual eruptions. Sea level surrounding 5 major volcanic eruptions and the average sea level in these 5 periods. The solid black curve shows detrended GSL (grey shows 95% confidence interval). Boxes show the median sea level (centre line of box) of the “Before”, “Rise” and “Drop” windows. Top and bottom edges show the 95% confidence interval of the median.
How robust is the result? Average impact of 9 major volcanoes on sea level weighted by global average stratospheric optical depth. Boxes show the mean sea level (centre line of box) of the “Before”, “Rise” and “Drop” windows with top and bottom edges showing the 95% confidence interval of the window mean. Thin green line shows detrended GSL, but weighted by Southern Hemisphere stratospheric aerosol optical depth. Average impact of 4 major volcanoes (excluding the 1902 Santa Maria eruption) on sea level. Boxes show the median sea level (centre line of box) of the “Before”, “Rise” and “Drop” windows. Top and bottom edges show the 95% confidence interval of the median.
Difference between modeled and observed effect Modeled sea level Observed sea level Church et al., 2005 Grinsted et al., 2007
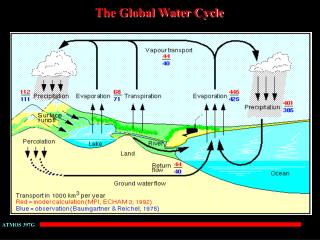
Summary • We examine the average impact on observed GSL of the 5 volcanic eruptions with the largest stratospheric aerosol loading since 1890 • We find that the initial response to a volcanic eruption is a significant rise in sea level of 9±3 mm in the first year after the eruption • This is followed by a drop of 7±3 mm in the period 2-3 years after the eruption relative to pre-eruption sea level. • We suggest that the mechanism is a transient disturbance of the water cycle with a delayed response of land river runoff relative to ocean evaporation and global precipitation that affects global sea level.
Reference Grinsted, A., J.C. Moore, and S. Jevrejeva. 2007. Observational evidence for volcanic impact on sea level and the global water cycle, PNAS, Vol, 104, nr. 50, 19730-19734, www.pnas.org_cgi_doi_10.1073_pnas.0705825104