Download
1 / 23
230 likes | 350 Vues
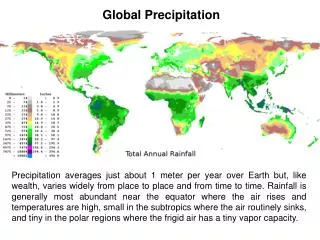
Satellite Measurements at High Frequencies Used for Mapping Global Precipitation. Fuzhong Weng NOAA/NESDIS/Office of Research and Applications L. Zhao - QSS Inc. Q. Liu - CIRA/CSU B. Yan - DSTI Inc.

E N D
Satellite Measurements at High Frequencies Used for Mapping Global Precipitation Fuzhong Weng NOAA/NESDIS/Office of Research and Applications L. Zhao - QSS Inc. Q. Liu - CIRA/CSU B. Yan - DSTI Inc. Presented at NASA Workshop on GPM Core Satellite Radiometer Improvements August 30 – 31 2001
Content • Observations • AMSU-B (89 – 150 GHz) • MIR (89 – 220 GHz) • AMSU precipitation/IWP algorithm • Physical basis and status • Potential improvements • Simulations of atmospheric and surface scattering at high frequencies • Polarization at 150 GHz • Split sounding channel at 174 and 194 GHz • Recommendations
Observations • AMSU-B Window Channels at 89 and 150 GHz • AMSU-B Sounding Channels at 183 GHz • MIR Measurements at 89, 150 and 220 GHz • MIR Sounding Channels at 183 GHz
AMSU Characteristics • AMSU is on board NOAA-15 and 16 satellites and provides 4 observations/per day at local times: 1:30,7:30,13:30,19:30. • There are 20 channels divided into three sub-modules: A1 – 13 channels located near the 60 GHZ oxygen absorption band A2 – 2 window channels at 23.8 and 31.4 GHz B – 2 high frequency channels at 89 and 150 GHz, and 3 channels near 183 GHz water vapor absorption line • The field-of-view varies as the instrument scans across a track
NASA ER-2 MIR, DC-8 Radar, MODIS Simulator Measurements (Weng and Grody, 2000, JAS)
AMSU Precipitation & Cloud Ice Water Algorithm • Primary channels:AMSU Ch16, 17 (89,150 GHz) • Secondary channels: AMSU-A Ch1, 2 (23.8, 31.4 GHz) • Surface screening algorithm • Retrieve both IWP, De and surface rain rate
AMSU Precipitation Algorithm • A microwave retrieval algorithm has been developed for cloud ice water path and ice particle size (Weng and Grody, 2000, JAS) • Brightness temperatures from AMSU- B 89 and 150 GHz are two primary channels for IWP and De. The AMSU-A window channels are used for surface screening. • The bulk volume density is an unknown parameter
AMSU Precipitation & IWP Algorithm (Zhao and Weng, 2001, JAM, Revised)
Ice Cloud ParameterGeorgia Tornadic Storm: February 14, 2000 Cloud Ice Water Path (kg/m2) Effective Diameter (mm)
Monthly Cloud Ice Water Path April, 1999
Effects of Surface vs Atmospheric Scattering on High Frequency • Simulation Sceneries: • Surface scatterers only • Atmosphere & surface scatterers • Purposes: differentiate surface scattering from atmosphere using • Polarization channels at 150 GHz • Splitting water vapor channels at 173 & 193 GHz • Methods: • Emissivity of snow simulated with dense medium theory • (Weng et al., 2001) • Brightness temperatures from RT model with NWP outputs
Snow Emissivity Spectra a = 0.5 mm vf = 0.3 a = 0.5 mm vf = 0.3 a = 0.5 mm vf = 0.3 a = 0.5 mm vf = 0.3
Brightness Temperature & Polarization at 150 GHz vs IWP Snow depth = 2 in Ev=0.82 Eh=0.78
Summary • The uncertainty in retrieving the cloud ice water path (also rainfall rate) is primarily caused by the uncertainty in the bulk volume density. There are needs for at least two window channels at high frequencies to reduce this uncertainty. • Over snow conditions, emissivity spectra show saturation at the frequency greater than 150 GHz. Thus, two high frequency channels, though being individually affected by surface, will uniquely identify the atmospheric scattering. • Snow surfaces, as aging, still display considerable polarization signals at 150 – 190 GHz, as simulated from the dense medium emissivity model. • Brightness temperatures and polarization at 150 GHz strongly correlate to the scattering of atmospheric falling snow. • Differential brightness temperatures at split 183 ±10 GHz are less affected by surface scattering as well as atmospheric water vapor absorption and therefore uniquely related to the scattering of atmospheric falling snow.
Recommendations for GPM • GPM may consider dual polarization channels at 150 GHz • GPM may consider a split 183±10 GHz design (e.g. 173 and 193 GHz)