Download
1 / 6
60 likes | 227 Vues
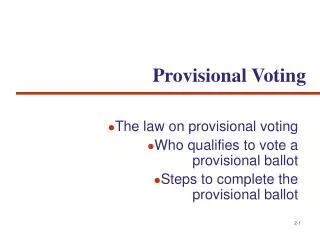
Some Empirical Evidence on Provisional Voting. Prepared for the Presidential Commission on Election Administration Daron Shaw University of Texas at Austin August 8, 2013. Provisional Ballots. Provisional Ballots Cast versus Counted.

E N D
Some Empirical Evidence on Provisional Voting Prepared for the Presidential Commission on Election Administration Daron Shaw University of Texas at Austin August 8, 2013
Provisional Ballots Provisional Ballots Cast versus Counted Source: Election Administration and Voting Study, 2004-12.
Provisional Ballots Source: Election Administration and Voting Survey, 2004-12.
Provisional Ballots Provisional ballots issued, as percentage of all ballots cast Provisional ballots rejected, as percentage of all ballots cast Source: Election Administration and Voting Survey, 2004-12.
Provisional Ballots Why were provisional ballots rejected? • Unregistered (45%) • Registered, at wrong precinct (11%) • Registered, at wrong jurisdiction (7%) • No identification (4%) • Incomplete/Illegible ballot (4%0 • Other (32%) Source: Election Administration and Voting Survey, 2004-12.
Provisional Ballots Who has a problem at the polling place? • In 2012, 2 percent reported experiencing a problem at the polls. • 19 percent of these reported casting a provisional ballot. • Those under 30 years of age (4.6% reported experiencing a problem), African-Americans (3.1%), and Latinos (3.0%) were above the mean. Source: 2012 Cooperative Congressional Election Study.