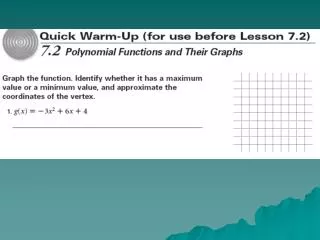
Polynomial Functions and Graphs
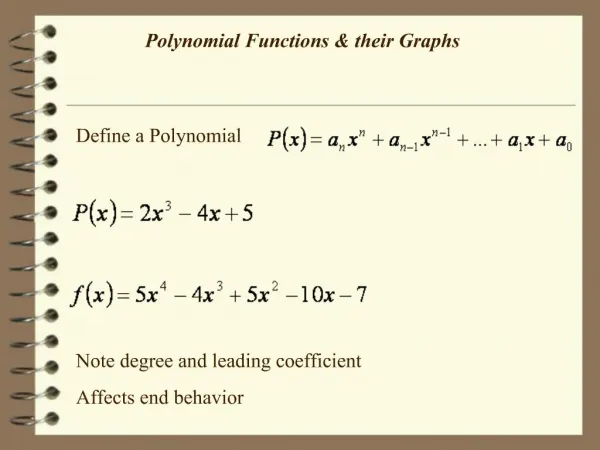
Polynomial Functions and Graphs. Higher Degree Polynomial Functions and Graphs. Polynomial Function A polynomial function of degree n in the variable x is a function defined by where each a i is real, a n 0, and n is a whole number. a n is called the leading coefficient

Polynomial Functions and Graphs
E N D
Presentation Transcript
Higher Degree Polynomial Functions and Graphs Polynomial Function A polynomial function of degree n in the variable x is a function defined by where each ai is real, an 0, and n is a whole number. • an is called the leading coefficient • n is the degree of the polynomial • a0 is called the constant term
Polynomial Functions The largest exponent within the polynomial determines the degree of the polynomial.
f(x) = 3 Polynomial Functions ConstantFunction Degree = 0 Maximum Number of Zeros: 0
Polynomial Functions f(x) = x + 2 LinearFunction Degree = 1 Maximum Number of Zeros: 1
Polynomial Functions f(x) = x2 + 3x + 2 QuadraticFunction Degree = 2 Maximum Number of Zeros: 2
Polynomial Functions f(x) = x3 + 4x2 + 2 Cubic Function Degree = 3 Maximum Number of Zeros: 3
Polynomial Functions Quartic Function Degree = 4 Maximum Number of Zeros: 4
Leading Coefficient The leading coefficient is the coefficient of the first term in a polynomial when the terms are written in descending order by degrees. For example, the quartic function f(x) = -2x4 + x3 – 5x2 – 10 has a leading coefficient of -2.
As xincreases or decreases without bound, the graph of the polynomial function f (x)=anxn+ an-1xn-1+ an-2xn-2 +…+a1x + a0 (an¹ 0) eventually rises or falls. In particular, For n odd: an> 0 an< 0 If the leading coefficient is positive, the graph falls to the left and rises to the right. If the leading coefficient is negative, the graph rises to the left and falls to the right. Rises right Rises left Falls right Falls left The Leading Coefficient Test
As xincreases or decreases without bound, the graph of the polynomial function f (x)=anxn+ an-1xn-1+ an-2xn-2 +…+a1x + a0 (an¹ 0) eventually rises or falls. In particular, For n even: an> 0an< 0 If the leading coefficient is positive, the graph rises to the left and to the right. If the leading coefficient is negative, the graph falls to the left and to the right. Rises right Rises left Falls left Falls right The Leading Coefficient Test
Rises right y x Falls left Example Use the Leading Coefficient Test to determine the end behavior of the graph of f (x)= x3+3x2-x- 3.
Determining End Behavior Match each function with its graph. B. A. C. D.
Graph A Graph B Quartic Polynomials Look at the two graphs and discuss the questions given below. 1. How can you check to see if both graphs are functions? • 2. How many x-intercepts do graphs A & B have? 3. What is the end behavior for each graph? 4. Which graph do you think has a positive leading coeffient? Why? 5. Which graph do you think has a negative leading coefficient? Why?
x-Intercepts (Real Zeros) Number Of x-Intercepts of a Polynomial Function A polynomial function of degree n will have a maximum of nx- intercepts (real zeros). Find all zeros of f (x)=-x4+4x3 - 4x2. -x4+4x3- 4x2 = 0 We now have a polynomial equation. x4-4x3+ 4x2= 0 Multiply both sides by -1. (optional step) x2(x2- 4x+ 4) = 0 Factor out x2. x2(x- 2)2= 0 Factor completely. x2= 0 or (x- 2)2= 0 Set each factor equal to zero. x= 0 x= 2Solve for x. (0,0) (2,0)
Multiplicity and x-Intercepts If r is a zero of even multiplicity, then the graph touches the x-axis and turns around at r. If r is a zero of odd multiplicity, then the graph crosses the x-axis at r. Regardless of whether a zero is even or odd, graphs tend to flatten out at zeros with multiplicity greater than one.
Example • Find the x-intercepts and multiplicity of f(x) =2(x+2)2(x-3) • Zeros are at (-2,0) (3,0)
Extrema • Turning points – where the graph of a function changes from increasing to decreasing or vice versa. The number of turning points of the graph of a polynomial function of degree n 1 is at most n – 1. • Local maximum point – highest point or “peak” in an interval • function values at these points are called local maxima • Local minimum point – lowest point or “valley” in an interval • function values at these points are called local minima • Extrema – plural of extremum, includes all local maxima and local minima
Number of Local Extrema • A linear function has degree 1 and no local extrema. • A quadratic function has degree 2 with one extreme point. • A cubic function has degree 3 with at most two local extrema. • A quartic function has degree 4 with at most three local extrema. • How does this relate to the number of turning points?
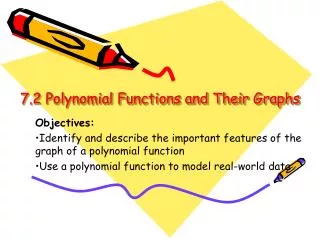
Comprehensive Graphs • The most important features of the graph of a polynomial function are: • intercepts, • extrema, • end behavior. • A comprehensive graph of a polynomial function will exhibit the following features: • all x-intercepts (if any), • the y-intercept, • all extreme points (if any), • enough of the graph to exhibit end behavior.