Understanding Polynomial Function Graphs
70 likes | 177 Vues
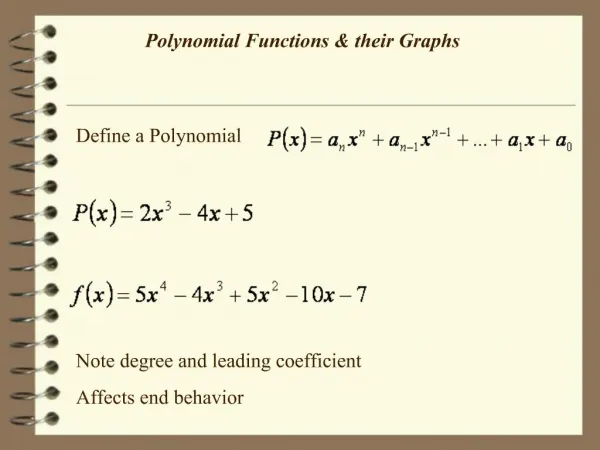
Learn about local extrema, zeros, and behavior of polynomial functions through graph analysis. Understand continuity, end behavior, and the Intermediate Value Theorem for polynomials.

Understanding Polynomial Function Graphs
E N D
Presentation Transcript
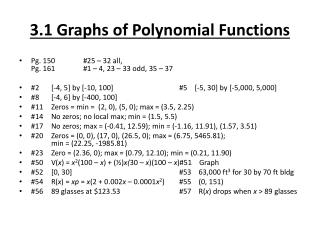
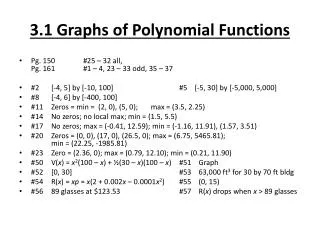
3.1 Graphs of Polynomial Functions • Pg. 150 #25 – 32 all, Pg. 161 #1 – 4, 23 – 33 odd, 35 – 37 • #2 [-4, 5] by [-10, 100] #5 [-5, 30] by [-5,000, 5,000] • #8 [-4, 6] by [-400, 100] • #11 Zeros = min = (2, 0), (5, 0); max = (3.5, 2.25) • #14 No zeros; no local max; min = (1.5, 5.5) • #17 No zeros; max = (-0.41, 12.59); min = (-1.16, 11.91), (1.57, 3.51) • #20 Zeros = (0, 0), (17, 0), (26.5, 0); max = (6.75, 5465.81); min = (22.25, -1985.81) • #23 Zero = (2.36, 0); max = (0.79, 12.10); min = (0.21, 11.90) • #50 V(x) = x2(100 – x) + ½(30 – x)(100 – x) #51 Graph • #52 [0, 30] #53 63,000 ft3 for 30 by 70 ft bldg • #54 R(x) = xp = x(2 + 0.002x – 0.0001x2) #55 (0, 15) • #56 89 glasses at $123.53 #57 R(x) drops when x > 89 glasses
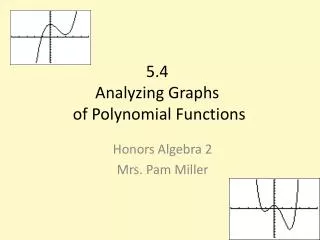
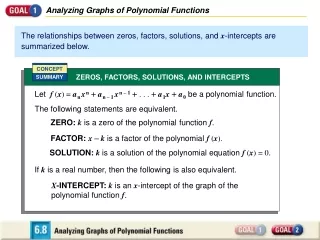
3.1 Graphs of Polynomial Functions Local Extrema Looking at Graphs For each of the following graphs: State the local extrema State the zeros State the intervals of increasing and decreasing • A local maximum occurs on an interval (a, b) if there is a value f(x) such that f(x) ≥ f(c) for all c in (a, b). • A local minimum occurs on an interval (e, f) if there is a value f(x) such that f(x) ≤ f(g) for all g in (e, f). • Why are they “Local?”
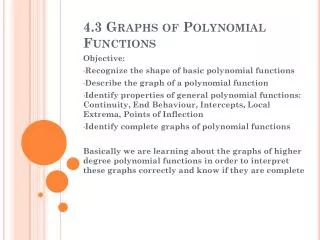
3.2 Continuity, IVT and End Behavior Graphing Polynomials Continuity A function is considered continuous on a given interval if it is possible to trace it on that given interval without lifting up your pencil. If the function fails to be continuous, it is discontinuous. All polynomial functions are continuous!! • What does a higher degree do to a function? • You need to memorize and be able to recognize immediately what functions will generally look like from key indicators!!
3.2 Continuity, IVT and End Behavior Points of Discontinuity Examples Determine if the following functions are continuous or discontinuous. If they are discontinuous, state why. • A function f has a point of discontinuity at x = a if on of the following conditions hold: • The function is not defined at x = a • The graph has a break at x = a • The graph has a hole at x = a
3.2 Continuity, IVT and End Behavior Intermediate Value Theorem (Property) • If a function is continuous on [a, b], then f assumes every value between f(a) and f(b). • If f(a) < L < f(b), then there is some number c in [a, b] such that f(c) = L.
3.2 Continuity, IVT and End Behavior The cool thing about polynomials… they are continuous EVERYWHERE!!!