Download
1 / 15
150 likes | 254 Vues
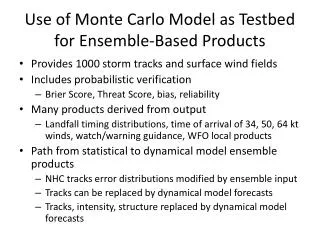
This study explores the use of a Monte Carlo model as a testbed for developing ensemble-based products to improve tropical storm and hurricane watch/warning guidance. By generating 1000 storm tracks and surface wind fields, the model enhances probabilistic verification methods, including Brier Score and Threat Score metrics. Key applications include landfall timing, intensity distributions, and objective guidance for issuing watches/warnings. Initial validation shows good skill and a significant potential reduction in warning lengths, ultimately aiming to refine watch and warning threshold thresholds based on model outputs.

E N D
Use of Monte Carlo Model as Testbed for Ensemble-Based Products • Provides 1000 storm tracks and surface wind fields • Includes probabilistic verification • Brier Score, Threat Score, bias, reliability • Many products derived from output • Landfall timing distributions, time of arrival of 34, 50, 64 kt winds, watch/warning guidance, WFO local products • Path from statistical to dynamical model ensemble products • NHC tracks error distributions modified by ensemble input • Tracks can be replaced by dynamical model forecasts • Tracks, intensity, structure replaced by dynamical model forecasts
1000 Realizations from MC Model for Hurricane Gustav 30 Aug 2008 at 12 UTC
Application: Distribution of time of arrival of 34, 50, 64 kt winds
Application: Objective Watch/Warning Guidance • Goal • Develop an objective scheme for issuing tropical storm and hurricane watches/warnings based on MC wind speed probability forecasts • Data • MC cumulative wind speed probabilities (64-kt and 34-kt) • U.S. mainland tropical storm and hurricane watches/warnings from 2004-2008 at 340 U.S. breakpoints • Methodology • Test various wind speed probability thresholds • prob > prob(up) –> put warning up • prob < prob(down) –> take warning down • Choose thresholds based on model fit (total distance of watch/warning) to NHC • Maximize threat score • Minimize MAE
Application: Objective Watch/Warning Guidance Example: Gustav 2008 Hurricane Warnings Blue = NHC only Green = MCP only Red = NHC and MCP Black Dashes = Observed Warning Lengths NHC = 560 nmi, MCP = 452 nmi, Obs = 145 nmi
Objective Watch/Warning GuidanceContinuing Work • Impacts of future track and intensity forecasts on watches and warnings • Reduce track and intensity errors sampled by the MC model • Use objective watch/warning scheme to assess resulting reduction in warning distance/duration • 20% error reduction 5% reduction in warning length • 50% error reduction 13% reduction in warning length • Example (right, Gustav 2008): • 20% error reduction 50 nmi (12%) warning reduction (blue) • TC conditions of readiness (TC-COR) guidance for DoD installations • TCCOR levels correspond to time of onset of 50-kt winds • TCCOR 1/2/3/4 correspond to 12/24/48/72 hours • Estimated TCCOR probability thresholds from Atlantic analyses • Initial validation indicates good skill (B. Sampson) • Collection of TC-COR data for various Atlantic and Pacific bases underway, use to refine thresholds
Application: WFO Local Products • Coordinated with P. Santos and D. Sharp on coastal and inland verification • Presented by P. Santos at 2010 AMS Conference • Used to define thresholds for product generation • Threat score the most useful 2004-08 cases 400 forecasts 20 TCs
Forecast Dependent Track Errors • Use GPCE input as a measure of track uncertainty • GPCE = Goerss Predicted Consensus Error • Divide NHC track errors into three groups based on GPCE values • Low, Medium and High • GPCE version accepted by NHC for (hopefully) 2010 operational implementation
Impact of GPCE input on MC Model 64 kt Wind Probabilities Hurricane Gustav 30 Aug 2008 18 UTC, Low Model Spread 64 kt 0-120 h cumulative probability difference field (GPCE-Operational) All GPCE values in “Low” tercile
Evaluation of GPCE Version in 2009 • Two evaluation metrics: Brier Score, Threat Score • Compare operational and GPCE versions AL01-AL11 WP01-WP28 EP01-EP20
Threat Score Improvements with GPCE version Atlantic West Pacific East Pacific
Next Step: Use Tracks from HFIP Ensembles Statistically generated tracks HFIP demo model tracks
Convergence of the MC model • Theoretical analysis of MC methods • Empirical test • Run with varying N • Compare to run with N=500,000 • N=1000 in operational model 64 kt wind probability error as a function of the number of realizations N for Hurricane Ike (2008) case
Impact of Ensemble NumberIke 2008 7 Sept 12 UTC N=10 N=100 N=10000 N=1000