Download
1 / 25
250 likes | 272 Vues
Explore experiment on sediment transport in open channels focusing on concentration profiles, drift velocity, and flow structures. Detailed analysis of spatial drift velocity structure and conclusions drawn from the study.

E N D
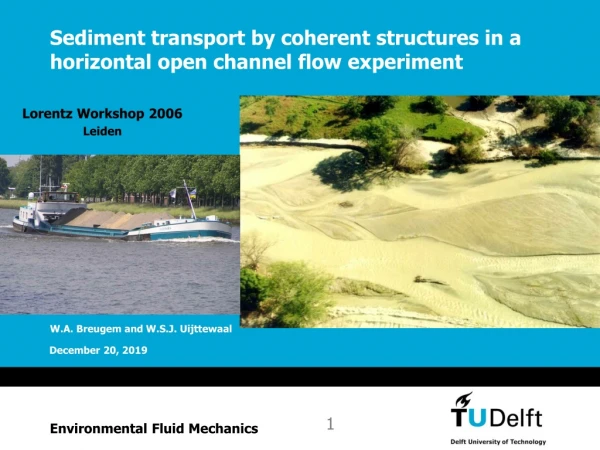
Sediment transport by coherent structures in a horizontal open channel flow experiment Lorentz Workshop 2006 Leiden W.A. Breugem and W.S.J. Uijttewaal Environmental Fluid Mechanics
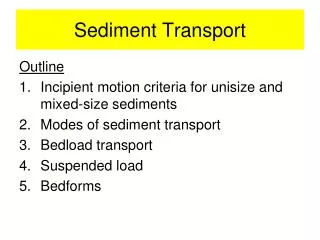
Overview • Introduction • Sediment transport in open channel flow • Experimental setup • Results • Concentration profile development • Drift velocity histogram • Spatial drift velocity structure • Conclusions Introduction - Experimental setup – Drift velocity - Flow structures - Conclusion
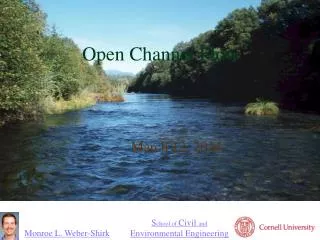
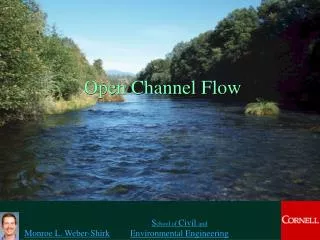
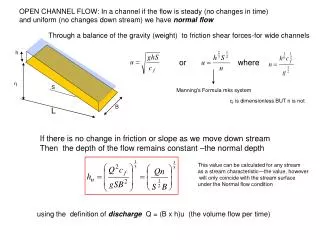
? ? ? ? ? ? Flow direction ? ? ? ? ? ? ? ? Sediment transport in open channel flow • Focus • Suspended sediment, hence outer region • Dilute flow (for now) g Introduction - Experimental setup – Drift velocity - Flow structures - Conclusion
Sediment feeder Oslim Sediment feeder Oslim Peristaltic Pump Peristaltic Pump Constant head vessel Constant head vessel Baffle Baffle Mixer Mixer Peristaltic Pump Peristaltic Pump Mixing vessel 23.50 m 23.50 m Mixing vessel Measurement section Measurement section 14.25 m 14.25 m Nozzle Main sieve Nozzle Main sieve 0.05 m 0.05 m Weir Weir 75 h 16 h Pump Buffer reservoir Return pipes (3 x) Pump Buffer reservoir Return pipes (3 x) Flume setup Introduction - Experimental setup – Drift velocity - Flow structures - Conclusion
Particle requirements • Comparison with DNS • Be suspended at Re =10,000 (i.e. u*/ws≈ 5) • dp/lk < 1 (assumption in Maxey & Riley eq.) • Rep < 1 (assumption in Maxey & Riley eq.) • Experimental procedure • Phase discrimination: dp >3 dtracer • Materials • Tracer: hollow glass (dtracer = 15 mm) • Sediment: polystyrene (dp = 375 mm, rp/rf≈1.035) Introduction - Experimental setup – Drift velocity - Flow structures - Conclusion
Instantaneous result • Re* ≈ 500 • Polystyrene particles • Flow from left to right • 0.8 ucl subtracted Introduction - Experimental setup – Drift velocity - Flow structures - Conclusion
Concentration profiles Introduction - Experimental setup – Drift velocity - Flow structures - Conclusion
Drift velocity • Drift from average Stokes drag force (Simonin et al., 1993): • I.e. The drift velocity is the deviation of the average fluid velocity seen by a particle. • Vertical momentum equation: Introduction - Experimental setup – Drift velocity - Flow structures - Conclusion
X=16 h X=75 h PDF vT=0.2u* Drift velocity profiles Introduction - Experimental setup – Drift velocity - Flow structures - Conclusion
Q2 Q2 Q2 Q2 Q1 Q1 Q1 Q1 Q3 Q3 Q3 Q3 Q4 Q4 Q4 Q4 Drift velocity PDF (Predominantly settling, x=16h) y/h = 0.55 vT=0.2u* Introduction - Experimental setup – Drift velocity - Flow structures - Conclusion
Q2 Q2 Q2 Q1 Q1 Q1 All particles V+ Q3 Q3 Q3 Q4 Q4 Q4 u+ Upgoing particles Downgoing particles V+ V+ u+ y/h = 0.55 u+ Drift velocity, deviation from random sampling (predominantly settling, x = 16 h) • More particles in Q4, less in Q2 • Downgoing particles in Q4 • Upgoing particles in Q1 and Q2 vT=0.2u* Introduction - Experimental setup – Drift velocity - Flow structures - Conclusion
Q2 Q2 Q2 Q2 Q1 Q1 Q1 Q1 Q3 Q3 Q3 Q3 Q4 Q4 Q4 Q4 Drift velocity histogram (fully developed, x =75 h) y/h = 0.55 vT=0.2u* Introduction - Experimental setup – Drift velocity - Flow structures - Conclusion
Q2 Q2 Q2 Q1 Q1 Q1 All particles • More particles in Q2 and Q3, less in Q4 • Downgoing particles in Q3 and Q4 • Upgoing particles in Q2 V+ Q3 Q3 Q3 Q4 Q4 Q4 u+ Upgoing particles Downgoing particles V+ V+ u+ y/h = 0.55 u+ Drift velocity, deviation from random sampling (fully developed, x = 75h) vT=0.2u* Introduction - Experimental setup – Drift velocity - Flow structures - Conclusion
v’ Q2 Q1 Q4 (fast) Q4 (fast) u’ Q2&Q3 (slow) Q2 (slow) Q3 Q4 Conceptual picture of particle transport Fully developed situation Settling situation Velocity Quadrants u’ Introduction - Experimental setup – Drift velocity - Flow structures - Conclusion
Spatial structure • The spatial structure is studied with conditional averages • Conditional averages are determined with Linear Stochastic Estimation (LSE). • With LSE, conditional averages can be calculated from two-point correlations. • A vortex head (rotating with the mean shear) at three different reference heights is used as condition. • Vortex identification is done with swirling strength. Introduction - Experimental setup – Drift velocity - Flow structures - Conclusion
Vectors Streamlines Free surface Bottom Shear layer Fluid flow structure (vortex near the wall) Q3 Q2 Introduction - Experimental setup – Drift velocity - Flow structures - Conclusion
Predominantly settling Fully developed Free surface Bottom Drift velocity structure (vortex near the wall) Introduction - Experimental setup – Drift velocity - Flow structures - Conclusion
Vectors Streamlines Free surface Bottom Fluid flow structure (vortex at 0.5 h) Q2 Q3 Introduction - Experimental setup – Drift velocity - Flow structures - Conclusion
Predominantly settling Fully developed Free surface Bottom Drift velocity structure (vortex at 0.5 h) Introduction - Experimental setup – Drift velocity - Flow structures - Conclusion
Flow Q2 Q4 Conceptual model (hairpin vortex) Introduction - Experimental setup – Drift velocity - Flow structures - Conclusion
Trapped particles (how does it get here?) Not so heavy particle in a vortex u2/r rp=O(rf) St < 1 p g Settling situation Introduction - Experimental setup – Drift velocity - Flow structures - Conclusion
HPV ISL HPV ISL HPV Q3 Q2 Q3 Conceptual picture fully developed situation Introduction - Experimental setup – Drift velocity - Flow structures - Conclusion
Spatial relation between Q2 & Q3 Introduction - Experimental setup – Drift velocity - Flow structures - Conclusion
Spatial relation between Q2 & Q4 Introduction - Experimental setup – Drift velocity - Flow structures - Conclusion
Conclusion • The increased concentration in either fast (settling situation) or slow (fully developed situation) flow structures, cause the mean particle velocity to differ from the mean fluid velocity. • Downward transport occurs in sweeps (Q4) and inward interactions (Q3), upward transport in ejections. • In predominantly settling, particles are found less in ejections (Q2) and more often in sweeps (Q4). • In fully developed situation, particles are found less sweeps, and more often in both ejections and inward interactions. This is due to the alignment of several hairpin vortices. Introduction - Experimental setup – Drift velocity - Flow structures - Conclusion