Analyzing Gene Expression Patterns in E. coli K12 Using DiProGB Genome Browser
10 likes | 126 Vues
This study presents a novel analysis of nucleotide motifs around gene start and stop positions in Escherichia coli K12 MG1655. Using the DiProGB genome browser, we identified significant differences in sequence patterns between highly and lowly expressed genes. The research utilized data from GenBank, EcoCyc, and the Many Microbe Microarrays Database to extract the top 400 genes from each expression group. Key findings reveal distinct purine-rich and A-rich motifs associated with gene expression levels, showcasing DiProGB as a powerful tool for understanding gene regulation.

Analyzing Gene Expression Patterns in E. coli K12 Using DiProGB Genome Browser
E N D
Presentation Transcript
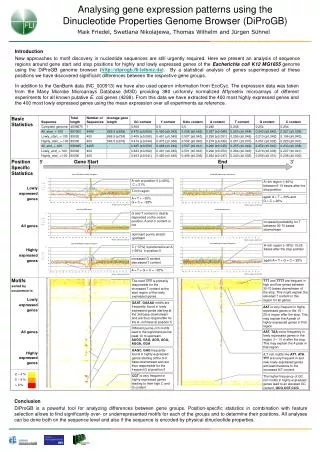
FLI Leibniz Graduate School on Ageing Analysing gene expression patterns using the Dinucleotide Properties Genome Browser (DiProGB) Maik Friedel, Swetlana Nikolajewa, Thomas Wilhelm and Jürgen Sühnel Introduction New approaches to motif discovery in nucleotide sequences are still urgently required. Here we present an analysis of sequence regions around gene start and stop positions for highly and lowly expressed genes of the Escherichia coli K12 MG1655genome using the DiProGB genome browser (http://diprogb.fli-leibniz.de). By a statistical analysis of genes superimposed at these positions we have discovered significant differences between the respective gene groups. In addition to the GenBank data (NC_000913) we have also used operon information from EcoCyc. The expression data was taken from the Many Microbe Microarrays Database (M3D) providing 380 uniformly normalized Affymetrix microarrays of different experiments for all known putative E. coli genes (4298). From this data we have extracted the 400 most highly expressed genes and the 400 most lowly expressed genes using the mean expression over all experiments as reference. A-rich at position 5 (>40%) , C = 21% A-rich region (~40%) between 6-10 bases after the stop position T-rich region again A = T = 30% and G = C = 20% A = T = ~30% G = C = ~20% G and T content is clearly depended on the codon position, A and C content is not increased probability for T between 30-70 bases downstream dominant purine stretch upstream A-rich region (~35%) 15-25 bases after the stop position C (~37%) is preferred over A (~29%) in position 5 increased G content decreased T content again A = T = G = C = 25% A = T = G = C = ~25% TTT and TTTT are frequent in high and low genes between 30-70 bases downstream of the stop. This might explain the elevated T content in this region for all genes. The motif TTT is primarily responsible for the increased T content at the start region of the lowly expressed genes. GAAT, GAAAA motifs are frequently found in lowly expressed genes starting at the 3rd base downstream and are thus responsible for the A –richness at position 5 AAT is very frequent in highly expressed genes in the 15 – 20 nt region after the stop. This may explain the A peak of highly expressed genes in that region. Different purine-rich motifs lead to the significant purine peak 10 nt upstream. AAGG, GAG, AGG, AGA, AGGA, GGA AAT, TAA occur frequently in lowly expressed genes in the region 3 – 10 nt after the stop. This may explain the A peak in that region. GAGC, GAG frequently found in highly expressed genes starting at the 3rd base downstream and are thus responsible for the frequent G at position 5 A,T rich motifs like ATT, ATA, TTT are very frequent in and near lowly expressed genes and lead therefore to the increased A/T content. CGT is very frequent in highly expressed genes leading to their high C and G content The higher frequency of GC rich motifs in highly expressed genes lead to an elevated GC content. GCG,CGT,CCG Conclusion DiProGB is a powerful tool for analyzing differences between gene groups. Position-specific statistics in combination with feature selection allows to find significantly over- or underrepresented motifs for each of the groups and to determine their positions. All analyses can be done both on the sequence level and also if the sequence is encoded by physical dinucleotide properties.