Linkage and Recombination
520 likes | 771 Vues
Linkage and Recombination. Mendel. Alleles segregate. Alleles for different genes assort independently. Morgan and Bridges. Genes are on chromosomes. Bateson et al. Pea plants have 7 pairs of chromosomes. Flies have 4 pairs. Humans have 23 pairs.

Linkage and Recombination
E N D
Presentation Transcript
Linkage and Recombination Mendel Alleles segregate Alleles for different genes assort independently Morgan and Bridges Genes are on chromosomes Bateson et al. Pea plants have 7 pairs of chromosomes. Flies have 4 pairs. Humans have 23 pairs.
What is the inheritance pattern for two traits determined by genes on the same chromosome? Human X chromosome “Linked” genes are those that do NOT assort independently. (They reside on the same chromosome.) DMD RP3 SCID XIST We will see that... PGK The corollary isn’t always true! HPRT Just because genes are on the same chromosome doesn’t necessarily mean they are linked. XLP Haemophilia Fragile X R-G Colorblindness
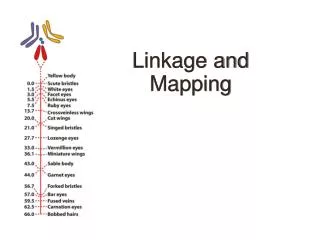
Mapping Genes on Chromosomes Alfred Sturtevant As a student in Morgan’s lab, Sturtevant was the first person to correctly interpret linkage; he created the first genetic maps. Sturtevant in his lab at Caltech
phenotypes: pr+ vg+ pr+ vg pr vg+ pr vg Segregation of genes on the same chromosome purple eyes vestigial wings pr pr vg vg wild type pr+ pr+ vg+ vg+ x wild type phenotype pr+ pr vg+ vg gamete? gamete? testcross [ ] testcross parent genotype? pr pr vg vg For I.A., expect: 1 : 1 : 1 : 1 ratio observed: 1339 : 151 : 154 : 1195
purple eyes vestigial wings pr pr vg vg wild type pr+ pr+ vg+ vg+ x occasional crossover wild type phenotype pr+ pr vg+ vg recombinant (non-parental) type gamete? gamete? How do we know the genotypes of the gametes? The genes are on the same chromosome & the parental alleles (mostly) co-segregate Sturtevant’s interpretation: parental type (same as gametes that made the parent) mostly Testcross parent’s gametes… only recessive alleles present So testcross progeny phenotypeallows us to deduce the heterozygous parent’s gamete genotype
cohesins sister chromatids (each is a double helix) homologues synaptonemal complex Single-strand nicks strand exchange Holliday junction [see lecture 2 for details] Recombination… a brief review -No deletions are caused by recombination. -No mutations are caused by recombination.
1 1 vg+ 2 2 3 pr+ vg+ pr 4 pr + vg pr 3 vg 4 Recombination… a brief review (cont) Segregation of recombinant chromosomes during Meiosis I Label the chromatids ALWAYS pull from the centromeres
Telophase II Recombination… a brief review (cont) Telophase I Gametes Parental Recombinant Recombinant Parental One recombination event: 2 recombinant and 2 non-recombinant products
Test your Understanding Which chromatid goes where? An example with a double crossover: Draw these chromosomes in anaphase I. Label all alleles appropriately.
ALWAYS pull from the centromeres 1 vg+ 2 pr+ vg pr pr + vg pr 3 vg+ 4
Crossing over must occur for faithful segregation at meiosis I Other types of crossovers # xovers resulting gametes 0 parental 2 (2 strands) parental! 2 parental 2 non-par. 2 (3 strands) 2 (4 strands) 4 non-par.
Sturtevant’s findings—summary Genes on the same chromosome can show linkage instead of independent assortment Gametes (mostly) have the same allele combinations as the homologs in the parent Recombination can give rise to gametes with non-parental (=recombinant) allele combinations Two parental types are more abundant and occur at roughly equal frequency to one another Non-parental types are less abundant and occur at roughly equal frequency to each other
pr+ vg+ pr vg pr+ vg pr vg+ X pr+ pr+ vg vg pr pr vg+ vg+ pr+ vg+ pr+ vg pr vg pr vg+ Identifying the parental type Option 1. Know the gametes that made the heterozygous parent The cross from our previous example: X pr+ pr+ vg+ vg+ pr pr vg vg dominant alleles together on the same chromosome = “cis” configuration gametes: define the parental type pr+ pr vg+ vg dominant alleles on different chromosomes = “trans” configuration gametes: A different cross from our example:
1287 1204 pr+ vg pr vg+ 170 154 Identifying the parental type Option 2. The two most abundant progeny types (assuming the genes are linked) Cross: pr+ pr vg+ vg x pr pr vg vg Progeny: What were the gametes that made the heterozygous parent?
= linkage Configuration (i.e., cis or trans) = pr+ pr vg+ vg implies pr+ w+ ; pr w separate chromosomes A notation system that defines allele configuration ??? Doesn’t make sense!
Sturtevant’s interpretation of linkage -Recombination involves the physical exchange of chromosomal segments between homologs. -The frequency of recombinant types indicates the distance between linked genes. What is the evidence in support of these hypotheses?
found genetically marked chromosome with structurally (visually) distinct homologues Test of Sturtevant’s hypothesis The problem: homologous chromosomes look alike… how to tell if they really exchanged segments? • Harriet Creighton and Barbara McClintock, maize • Curt Stern, Drosophila Prediction: Chromosome from genetically recombinant plants should show structural rearrangement
Progeny phenotypes recombinant genotypes and chromosomes! colored, waxy colorless, starchy colored, starchy colorless, waxy Creighton/McClintock test Sturtevant’s hypothesis Structural markers: Genetic markers: C = colored Wx = starchy c = colorless wx = waxy “knob” translocation x Conclusion: genetic recombination exchange of chromosome segments
Mapping genes using recombination Alfred Sturtevant’s major insight: If crossovers occur at random Probability of crossover between two genes is proportional to the distance between them Crossover between A and B much more likely than between B and D
1287 1204 170 154 Map distance… example from last time Cross: pr+ pr vg+ vg x pr pr vg vg Progeny: What is the map distance between these two genes?
parental types (most abundant) non-parental types (least abundant) Map distance… example (cont’d) Step 1. Identify the parental and non-parental types. 1287 1204 170 154 parental = non-parental = pr+ vg and pr vg+ pr+ vg+ and pr vg
parental types (most abundant) non-parental types (least abundant) x100 (170 + 154) (170+154+1287+1204) Map distance… example (cont’d) Step 2. Calculate % recombinant products. 1287 1204 170 154 = 11.5% % recombinant = Map distance = 11.5 map units = 11.5 centiMorgan’s (cM)
Another Example (recessive b mutation) 4615 red black 4707 purple tan 307 red tan 295 purple black Which are the parental types? and the recombinant types? Recombination Frequency = Number Recombinant Types Total Number of Progeny pr b Example:
Another Example (recessive b mutation) 4615 red black 4707 purple tan 307 red tan 295 purple black Parental types Recombinant types pr + b pr b + pr + b + pr b Recombination Frequency = Number Recombinant Types Total Number of Progeny pr b Example: 307 + 295 602 = 0.06 x 100 = 6.0 % 4615 + 4707 + 307 + 295 9924
b+ pr+ vg+ b pr vg Creating a Genetic Map Genetic loci: % Recombinants purple - vestigial (pr - vg) 11.5 % purple - black (pr - b) 6.0 % Revealed from other crosses vestigial - black (vg - b) 16.5 % Alfred Sturtevant’s mental leap: % recombinants is directly proportional to distance He drew a genetic map of the second chromosome: 6 cM 11.5 cM pr vg b Why 17.5cM and not 16.5cM?
Genes very close together… Low probability of crossover between them …very few recombinants “tight linkage” Genes further apart… more recombinants Point to ponder: If you examined a population of meioses, what is the maximum recombination frequency you could see between two genes?
Summary * Crossing-over creates new combinations of traits. * Two Parental types in ≈ frequencies. Two Recombinant types ≈ frequencies. * If genes are linked, Parental types > recombinant types. * The frequency of recombinant types indicates the distance between linked genes.
Practice question The pedigree shows segregation of two disorders one is autosomal dominant (A= disease, a = not) one is autosomal recessive (b = disease, B = not). Is the gamete that III-1 received from II-2 parental or non-parental? BUT FIRST… break down the question: Talk to your neighbors and devise a systematic, step-by-step strategy to solve the problem I 1 2 II 1 2 Step 1. Step 2. Step 3. etc. III 1 = autosomal dominant = autosomal recessive = both traits
Practice question The pedigree shows segregation of two disorders one is autosomal dominant (A= disease, a = not) one is autosomal recessive (b = disease, B = not). Is the gamete that III-1 received from II-2 parental or non-parental? BUT FIRST… break down the question: Talk to your neighbors and devise a systematic, step-by-step strategy to solve the problem I 1 2 II 1 2 Step 1. Figure out all the genotypes! Step 2. What are the gametes that made II-2? Step 3. What is the gamete that II-2 made? Step 4. Does the gamete that II-2 made have a different genotype than the gamete(s) that made him? III 1 = autosomal dominant = autosomal recessive = both traits
gamete AB ab ab Ab The pedigree shows segregation of two disorders one is autosomal dominant (A= disease, a = not) one is autosomal recessive (b = disease, B = not). AB ? ? ab a b Is the gamete that III-1 received from II-2 parental or non-parental? I 1 2 aB a b AB a b II 1 2 Gametes that made II-2= Gamete that II-2 gave to III-1= AB and ab Ab a b III 1 = autosomal dominant Ab = autosomal recessive = both traits
Quiz Section this week: yeast tetrad analysis (genetic mapping) An introduction to the yeast tetrad analysis terminology. . .
In yeast… Tetrad of spores… can examine products of individual meioses! diploid 4 haploid spores meiosis 2n 1n Tetrad with only the 2 parental types = “parental ditype” (PD). Tetrad with only the 2 recomb. types = “non-parental ditype” (NPD). non-parental Tetrad with all four combinations = “tetratype” (T). Looking at whole tetrads (PD/NPD/T) is informative.
no yes no no Example Suppose URA1 and URA2 are on the same chromosome… Growth on -ura plates? Diploid Spores Parental ditype? Non-parental ditype? Tetratype?
1+ 2- 1- 2- 1+ 2- 1- 2- and 1- 2+ 1+ 2+ 1- 2+ 1+ 2+ PD NPD Exercise Suppose URA1 and URA2 are on separate chromosomes, but each tightly linked to their respective centromeres… what kinds of tetrads (growth on -ura plates) would this diploid produce? 1+ = URA1 1- =ura1 2+ =URA2 2- =ura2
Test cross Long, no speck: 2929 Vestigial, no speck: 2070 Vestigial, speck: 2921 Long, speck: 2080 Using 2 analysis to explore linkage P1 cross: X long, no speck vestigial, speck F1 : All long, no speck Can these results be explained by chance deviation from independent assortment?
Using 2 analysis to explore linkage Is this really a 1:1:1:1 ratio as we would expect for independent assortment? Is the deviation from independent assortment due to chance? 2 analysis: Test the “null” hypothesis—that the observed deviation from 1:1:1:1 segregation is due to chance variation. Why test the null hypothesis? It gives a precise expectation (1:1:1:1) We cannot test directly for linkage, because (assuming they are linked) we do not know the map distance separating these genes.
(o-e)2 e 2analysis (Obs-Exp)2 S 2= • Exp Out of 10,000 testcross progeny . . . observed expected (o-e)2 long no speck 2929 vestigial speck 2921 vestigial no speck 2070 long speck 2080
P df 1 2 3 4 5 6 0.995 0.000 0.010 0.072 0.207 0.412 0.676 0.975 0.000 0.051 0.216 0.484 0.831 1.237 0.900 0.016 0.211 0.584 1.064 1.610 2.204 0.500 0.455 1.386 2.366 3.357 4.351 5.348 0.100 2.706 4.605 6.251 7.779 9.236 10.645 0.050 3.841 5.991 7.815 9.488 11.070 12.592 0.025 5.024 7.378 9.348 11.143 12.832 14.449 0.010 6.635 9.210 11.345 13.277 15.086 16.912 0.005 7.879 10.597 12.838 14.860 16.750 18.548 2 table Degrees of freedom? REJECT What is the P value? What does this P value mean? NO WAY could these numbers be due to independent assortment!
Practice question Homework Test whether the data truly show linkage by doing a Chi-square analysis. What is the null hypothesis? speck P1 cross: X long, no speck vestigial, speck F1 : All long, no speck Draw the chromosomes of the F1 hybrid in prophase of Meiosis I such that the gametes will produce all four progeny types.
Practice question What if Sturtevant had analyzed only 100 testcross progeny? Out of 100 testcross progeny . . . (o-e)2 (o-e)2 observed expected e long no speck 29 vestigial speck 29 vestigial no speck 21 long speck 21 What is the P value? What does this P value mean?
2 analysis (o-e)2 e = 0.64 42 25 42 = 0.64 25 42 = 0.64 25 42 = 0.64 25 = 2.56 The “null” hypothesis: The testcross data do not significantly differ from a 1:1:1:1 ratio. (Obs-Exp)2 2= • Exp Out of 100 testcross progeny . . . observed expected (o-e)2 long no speck 29 vestigial speck 29 vestigial no speck 21 long speck 21
P df 1 2 3 4 5 6 0.995 0.000 0.010 0.072 0.207 0.412 0.676 0.975 0.000 0.051 0.216 0.484 0.831 1.237 0.900 0.016 0.211 0.584 1.064 1.610 2.204 0.500 0.455 1.386 2.366 3.357 4.351 5.348 0.100 2.706 4.605 6.251 7.779 9.236 10.645 0.050 3.841 5.991 7.815 9.488 11.070 12.592 0.025 5.024 7.378 9.348 11.143 12.832 14.449 0.010 6.635 9.210 11.345 13.277 15.086 16.912 0.005 7.879 10.597 12.838 14.860 16.750 18.548 2 table Degrees of freedom? Can’t Reject What does this P value mean? Yes, these numbers could be due to independent assortment! Since Sturtevant DID analyze more flies, however, we are certain that vg and sp are linked.
Where does speck map? Genetic loci: % Recombinants purple - vestigial (pr - vg) 11.5 % purple - black (pr - b) 6.0 % vestigial - black (vg - b) 16.5 % vestigial - speck (vg - sp) 41.5 % 41.5 cM 41.5 cM 6 cM 11.5 cM sp? sp? pr vg b How do we distinguish these possibilities? If to the left, fewer recombinants with pr (and b). If to the right,more recombinants with pr (and b).
pr sp pr sp pr+ sp + pr+ sp+ F1 : testcross parent X F1 dihybrid Testcross progeny: red no speck purple speck purple no speck red speck Parental types Recombinant types P1 cross: X 2504 2498 2501 2497
Where shall we place speck? Genetic loci: % Recombinants 11.5 % purple - vestigial (pr - vg) 6.0 % purple - black (pr - b) 16.5 % vestigial - black (vg - b) 41.5 % vestigial - speck (vg - sp) 6 cM 10.7 cM 41.5 cM sp pr vg b What is the map distance between b and sp? ~58.2 cM