Download
1 / 40
400 likes | 608 Vues
Remote sensing and modeling in forestry Lecture 2 Reflectance curves (spectral signatures). Dario Papale Contributions: Vern Vanderbilt, TA- Quinn Hart, CCRS.

E N D
Remote sensing and modeling in forestry Lecture 2 Reflectance curves (spectral signatures) Dario Papale Contributions: Vern Vanderbilt, TA- Quinn Hart, CCRS
where F0is the incoming EM energy flux in the spectral range dlandFa, FrandFtare the absorbed, reflectted and transmitted fluxes in the same spectral range. Reflection of radiation Incident radiation on a surface can be adsorbed, transmitted or reflected and for the energy conservation principle we have:: Ri = Ra + Rr + Rt Given an infinitesimal spectral range dλ, we can define spectral absorbance (), reflectance () and trasmittance () the ratios:
Reflected radiation Different surfaces reflect a portion of the incoming EM radiation, function of their chemical and phisical properties and of the wavelength
Reflectance curves Reflectance curves: describe the typical reflectance trend of a surface in the spectral range 0.4 – 2.5 μm. Clearly the spectral reflectance of a surface is also function of the environmental conditions (period of the year, chamical and physical status, etc.) and data acquisition conditions (Sun position, point of view). It is possible to define the typical average reflectance curve of a surface that, althoug can be only indicative, provides important information about the behaviour of the surface in respect to its interaction with readiation.
Reflectance curves Reflectance curves: describe the typical reflectance trend of a surface in the spectral range 0.4 – 2.5 μm. Clearly the spectral reflectance of a surface is also function of the environmental conditions (period of the year, chamical and physical status, etc.) and data acquisition conditions (Sun position, point of view). It is possible to define the typical average reflectance curve of a surface that, althoug can be only indicative, provides important information about the behaviour of the surface in respect to its interaction with readiation.
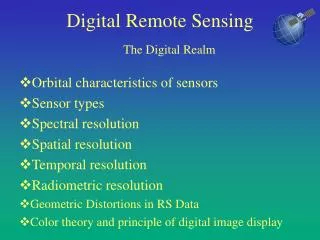
1 4 2 5 3 6 Factors that influence the reflectance in forests • Sun-sensor geometry • Aspect • Slope • Atmosphere • Intrinsic characteristics • Substrate
Lambertian surface non-Lambertian surface Bidirectionality of reflectance
BRDFBidirectional Reflectance Distribution Function Sun behind the observer Sun in front of the observer
BRDF Sun behind the observer Sun in front of the observer
BRDF Sun behind the observer Sun in front of the observer
θv=-75º θv=-45º nadir θv=+45º θv=+75º Images: SpectroLab, Remote Sensing Laboratories, University of Zurich BRDF = Lr(i,i;r,r)/ Ei(i,i)
x x Reflectance anisotrophy as function of the Sun angle Reflectance anisotrophy as function of the observation angle Widlowski, RAMI-JRC
“hot spot” BRDF Forward scatter direction Backscatter direction
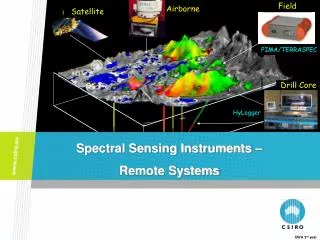
Multispectral Hyperspectral Building a spectral reflectance curve
Absorbance curve of water Absorbance (%) Wavelength (μm)
Water reflectance Clear water (<10 mg/l of particles) Dirty water (>100 mg/l of particles) Reflectance (%) Wavelength (μm)
5 1,000 mg/l 4 .5 Clayey soil 4 300 250 3 .5 200 150 3 100 2 .5 Percent Reflectance 50 2 clear water 1 .5 1 0.5 0 a. 900 400 450 5 00 55 0 6 00 65 0 7 00 75 0 8 00 85 0 Wavelength (nm) 14 1,000 mg/l 550 Silty soil 12 500 450 600 350 400 300 10 250 200 150 8 Percent Reflectance 100 6 50 4 clear water 2 0 b . 900 400 450 5 00 55 0 6 00 65 0 7 00 75 0 8 00 85 0 Wavelength (nm) Clear water reflectance and different levels of suspended sediments Han, 1997; Jensen, 2000
4 3 .5 3 clear water algae-laden 2 .5 water 2 Percent Reflectance 1 .5 1 25 Algae-Laden Water with Various 0.5 Suspended Sediment Concentrations 20 0 5 00 6 00 7 00 8 00 900 a. 500 mg/l 400 Wavelength (nm) 15 Percent Reflectance 10 5 0 mg/l 0 5 00 6 00 7 00 8 00 b . 900 400 Wavelength (nm) Clear water reflectance and different levels of algae Han, 1997; Jensen, 2000
4 3 .5 3 clear water algae-laden 2 .5 water 2 Percent Reflectance 1 .5 1 25 Algae-Laden Water with Various 0.5 Suspended Sediment Concentrations 20 0 5 00 6 00 7 00 8 00 900 a. 500 mg/l 400 Wavelength (nm) 15 Percent Reflectance 10 5 0 mg/l 0 5 00 6 00 7 00 8 00 b . 900 400 Wavelength (nm) Clear water reflectance and different levels of algae Han, 1997; Jensen, 2000
Global Chlorophyll a (g/m3) Derived from SeaWiFS Imagery Obtained from September 3, 1997 through December 31, 1997 Jensen, 2000
Snow reflectance Snow two days old Fresh snow Reflectance (%) Wavelength (μm)
Difference in the reflectance of snow and clouds Jensen, 2000
Reflectance curves of different bare soils with different water content Sandy soil Reflectance (%) Wavelength (μm) Silt soil Reflectance (%) Wavelength (μm) Clay soil Reflectance (%) Wavelength (μm)
Spectral reflectance of soils with different organic matter content
Vegetation reflectance curve Leaf and Canopy structure Pigments Water content Reflectance (%) Chlorophyll absorption Water absorption Wavelength (μm)
Vegetation reflectance curve Leaf and Canopy structure Pigments Water content Reflectance (%) Chlorophyll absorption Water absorption Wavelength (μm)
What influence the vegetation reflectance • Single leaf level: • Chlorophyll content • Cellular structure • Water content • Canopy level: • Degree of coverage • Green biomass quantity • Canopy architecture • Understory presence and characteristics • Phenology • Healty status • External factors (slope, geometry Sun-surf-sensor, atmosphere… )
Vegetation reflectance and water assorbance Vegetation Water Reflectance – Absorbance (%) Wavelength (μm)
Water content of vegetation Reflectance (%) Wavelength (μm)
Chlorophyll b Absorption Spectra of Chlorophyll a and b Chlorophyll a Absorption Efficiency 0.25 0.3 0.35 0.4 0.45 0.5 0.55 0.6 0.65 0.7 a. v iolet b lue g reen y ellow red Wavelength, m m Chlorophyll absorption
Very high absorption Absorption in the visible is reduced when there are less pigments Pigments and chlorophyll effect on visible radiation absorption by leaves Very low absorption Very low chlorophyll concentration, very low light absorption Very high light absorption, very high chlorophyll concentration
Reflectance of needleleaf and broadleaf canopies Broadleaf (acer) Reflectance (%) Needleleaf (pine) Wavelength (μm)
Vegetation reflectance and LAI Incident radiation Reflected radiation Transmitted radiation Absorbed radiation
Riflettanza della vegetazione e LAI Layers of leaves (LAI) Reflectance (%) Wavelength (μm)