Download
1 / 77
800 likes | 1.18k Vues
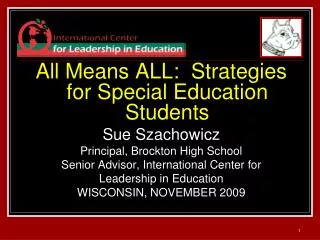
What Gets Monitored Is What Gets Done!!! Sue Szachowicz Principal, Brockton High School Senior Advisor, International Center for Leadership in Education WISCONSIN, NOVEMBER 2009. TODAY’S AGENDA:. Implementing the Literacy Initiative Across the Curriculum

E N D
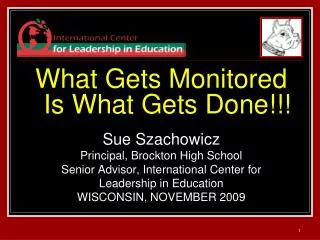
What Gets Monitored Is What Gets Done!!! Sue Szachowicz Principal, Brockton High School Senior Advisor, International Center for Leadership in Education WISCONSIN, NOVEMBER 2009
TODAY’S AGENDA: • Implementing the Literacy Initiative Across the Curriculum • What Gets Monitored Is What Gets Done • All Means ALL: Strategies for Special Education Students • Building Relationships with Faculty, Students, and Parents
Monitoring the Implementation: Rubrics for the Students Collecting Student Work Evaluation Fierce Conversations
BROCKTON HIGH SCHOOL • Comprehensive 9 – 12 • Enrollment: over 4,300 • Poverty Level: 72% • Minority population: 71% • 30 different languages represented • 38% do not speak English as their primary language • Approximately 12% in Transitional Bilingual Ed. • Approximately 11% receive Special Education Services 4
Student Population 55.5% Black - includes African-American, Cape Verdean, Haitian, Jamaican, and others 27.3% White 14% Hispanic 2.7% Asian .5% American Indian 5
MCAS 1998 Failure ELA – 44% (Sped – 78%) MATH – 75% (Sped – 98%) MCAS 1998 Advanced+Proficient ELA – 22% MATH – 7% State Mandates…We faced: 6
SAMPLE MCAS QUESTION: Life of Henry V: Act IV, Scene III (ll. 1-80) Open Response question Explain how the excerpt shows that the king is an effective leader. Use relevant and specific information from the excerpt to support your answer. (Question is looking for language and style analysis, not simply content). 7
SAMPLE MCAS QUESTION: Excerpt from Don Quixote (pp 58-60) Open Response Question Explain how the author creates a humorous tone in the excerpt. Use relevant and specific information from the excerpt to support your answer. (Question is looking for language analysis, not simply content). 8
SAMPLE MCAS MATH QUESTION: Jason launched a model rocket from the ground. The formula below can be used to determine the height of the rocket above the ground at any time during the rocket’s flight. h = 16t(7 – t) In the formula, h and t are defined as follows: • t = the time, in seconds, that has elapsed since the rocket was launched • h = the height, in feet, of the rocket above the ground at time t Use the formula to answer the following questions. a. What was the height, in feet, of the rocket 1 second after it was launched? Show your work. b. What was the height, in feet, of the rocket 6 seconds after it was launched? Show your work. c. The value of h was 0 when the rocket hit the ground. How many seconds after the rocket was launched did it hit the ground? Show your work. d. How many seconds after the rocket was launched was the height of the rocket 160 feet? Show your work. 9
SAMPLE MCAS BIOLOGY QUESTION: Corn snakes show variety in their skin color pattern. While the complete genetics of corn snake color are complex, the most common colors on normal corn snakes—red and black—are each coded by one gene. For the red gene, the allele for the presence of red pigment (R) is dominant and the allele for the absence of red pigment (r) is recessive. Likewise, for the black gene, the allele for the presence of black pigment (B) is dominant and the allele for the absence of black pigment (b) is recessive. • Draw the Punnett square for the cross of a snake that is homozygous dominant for the red color with a snake that is heterozygous for the red color. What percentage of the offspring is expected to have red pigment in their skin? b. Draw the Punnett square for the cross of two snakes that are heterozygous for the black color. What percentage of the offspring are expected to have black pigment in their skin? c. The parent snakes in part (b) that are heterozygous for black color are both homozygous recessive for the red gene. Each parent has genotype rr for the red gene. Based on this information, what percentage of their offspring are expected to lack both the red and black pigments in their skin? Explain your reasoning.
SAMPLE MCAS BIOLOGY QUESTION: Corn snakes show variety in their skin color pattern. While the complete genetics of corn snake color are complex, the most common colors on normal corn snakes—red and black—are each coded by one gene. For the red gene, the allele for the presence of red pigment (R) is dominant and the allele for the absence of red pigment (r) is recessive. Likewise, for the black gene, the allele for the presence of black pigment (B) is dominant and the allele for the absence of black pigment (b) is recessive. • Draw the Punnett square for the cross of a snake that is homozygous dominant for the red color with a snake that is heterozygous for the red color. What percentage of the offspring is expected to have red pigment in their skin? b. Draw the Punnett square for the cross of two snakes that are heterozygous for the black color. What percentage of the offspring are expected to have black pigment in their skin? c. The parent snakes in part (b) that are heterozygous for black color are both homozygous recessive for the red gene. Each parent has genotype rr for the red gene. Based on this information, what percentage of their offspring are expected to lack both the red and black pigments in their skin? Explain your reasoning. c. The parent snakes in part (b) that are hetero-zygous for black color are both homozygous recessive for the red gene. Each parent has genotype rr for the red gene. Based on this information, what percentage of their offspring are expected to lack both the red and black pigments in their skins. Explain your reasoning.
Eight Components of School Reform Embrace a Common Vision and Goals Inform Decisions Through Data Systems Empower Leadership Teams to Take Action and Innovate Clarify Student Learning Expectations Adopt Effective Instructional Practices Address Organizational Structures Monitor Progress/Improve Support Systems Refine Process on an Ongoing Basis
RIGOR: HIGH standards, HIGH expectations for ALL students It all started with that!
The “WHAT”: LITERACY for ALL: Reading, Writing, Speaking, Reasoning
Two pronged approach: 1. Literacy skills for ALL – NO EXCEPTIONS!!! 2. Safety nets and interventions for stuggling learners (More later on that)
How did we determine our focus? Literacy Skills Drafted: 16
Faculty Meetings became Literacy Workshops
Our Professional Development Model: Development of Scripts Train the Trainer Interdisciplinary and Dept. workshops Implementation calendar Assessing with rubric Monitoring/collecting student work 19
OPEN RESPONSE STEPS TO FOLLOW 1. READ QUESTION CAREFULLY. 2. CIRCLE OR UNDERLINE KEY WORDS. 3. RESTATE QUESTION AS THESIS(LEAVING BLANKS). 4. READ PASSAGE CAREFULLY. 5. TAKE NOTES THAT RESPOND TO THE QUESTION. BRAINSTORM & MAP OUT YOUR ANSWER. 6. COMPLETE YOUR THESIS. 7. WRITE YOUR RESPONSE CAREFULLY,USING YOUR MAP AS A GUIDE. 8. STATEGICALLY REPEAT KEY WORDS FROM THESIS IN YOUR BODY AND IN YOUR END SENTENCE. 9. PARAGRAPH YOUR RESPONSE. 10. REREAD AND EDIT YOUR RESPONSE.
Our Professional Development Model: Development of Scripts Train the Trainer Interdisciplinary and Dept. workshops Implementation calendar Assessing with rubric Monitoring/collecting student work 21
As a follow up to this activity, I am requiring Department Heads to collect from each teacher at least one student sample from each of the teachers’ classes. The student samples should include: Student Name Teacher Name Date Course Name and Level Period A copy of the reading selection and question Evidence of the student’s active reading All pre-writing work that the student has done, e.g. webs A copy of the written open response The new scoring rubric and completed assessment After you have collected the samples from each teacher and have had the opportunity to review them for quality and completeness, please send them to me in a department folder with a checklist of your teachers. Again, please be sure that your teachers clearly label their student samples. The Open Response calendar of implementation for 2009 is as follows: Jan. 12–16: Social Science, Social Science Biling. Jan. 20–23: Wellness, JROTC Jan. 26-30: Final Exams /Beginning of Term Feb. 2-6: Beginning of Term 3 Feb. 9-13: Science, Science Bilingual Feb. 16-20: VACATION Feb. 23-27: Business, Technology and Career Ed. March 2-6: Math, Math Bilingual March 9-13: Foreign Lang, Special Ed, ESL Bilingual Mar. 16-20: Family &Cons. Science, Project Grads Mar. 23-27: Music, Art
So, HOW do we know our students are learning it? One method: School wide rubrics
Assessment using our specific Open Response Writing Rubric Example...
Evaluated by: Self Peer Teacher (Circle One)SCORING 13-14 = Advanced 11-12 = Proficient 8-10 = Needs Improvement 0-7 = Failing
CONTENT: 8 Response contains a clear thesis and insightfully answers all parts of the question. Response provides relevant and specific textual evidence. Explanations of evidence are clear and accurate, and demonstrate superior understanding of the material. 6 Response contains a clear thesis and adequately answers all parts of the question. Response provides relevant but general textual evidence. Explanations of evidence are mostly clear and accurate, and demonstrate good understanding of the material. Evaluated by: Self Peer Teacher (Circle One) SCORING 13-14 = Advanced 11-12 = Proficient 8-10 = Needs Improvement 0-7 = Failing
FORM: 4 Response contains sophisticated and effective use of transitions and strategic repetition indicating complete control of the material. Response is logically and effectively organized in its thesis, paragraphing, and sequencing of examples. Response contains clear sentence structure with few or no errors. 3 Response contains adequate but simplistic use of transitions and strategic repetition. Response is organized in its thesis, paragraphing, and sequencing of examples. Response contains clear sentence structure with no distracting errors. Evaluated by: Self Peer Teacher (Circle One) SCORING 13-14 = Advanced 11-12 = Proficient 8-10 = Needs Improvement 0-7 = Failing
Evaluated by: Self Peer Teacher (Circle One) SCORING 13-14 = Advanced 11-12 = Proficient 8-10 = Needs Improvement 0-7 = Failing Evaluated by: Self Peer Teacher (Circle One) SCORING 13-14 = Advanced 11-12 = Proficient 8-10 = Needs Improvement 0-7 = Failing
What gets monitored is what gets done!!! For the students AND the teachers…
MATH 31
Oral Presentation Rubric
As I mentioned before, each type of graph has characteristics that make it useful in certain situations. Some of the strengths of line graphs are that: - They are good at showing specific values of data, meaning that given one variable the other can easily be determined. - They show trends in data clearly, meaning that they visibly show how one variable is affected by the other as it increases or decreases. -They enable the viewer to make predictions about the results of data not yet recorded. Unfortunately, it is possible to alter the way a line graph appears to make data look a certain way. This is done by either not using consistent scales on the axes, meaning that the value in between each point along the axis may not be the same, or when comparing two graphs using different scales for each. It is important that we all be aware of how graphs can be made to look a certain way, when that might not be the way the data really is. Line Graphs Line graphs compare two variables. Each variable is plotted along an axis. A line graph has a vertical axis and a horizontal axis. So, for example, if you wanted to graph the height of a ball after you have thrown it, you could put time along the horizontal, or x-axis, and height along the vertical, or y-axis. Let's take a look at an example. In a few years, you might be interested in getting some kind of part-time job. You find the following line graph, which plots the minimum wage versus time from October, 1938, to September, 1997. What kinds of things might you be able to tell from it?
They are good at showing specific values of data, meaning that given one variable the other can easily be determined. • They show trends in data clearly, meaning that they visibly show how one variable is affected by the other as it increases or decreases. • -They enable the viewer to make predictions about the results of data not yet recorded. As I mentioned before, each type of graph has characteristics that make it useful in certain situations. Some of the strengths of line graphs are that: - They are good at showing specific values of data, meaning that given one variable the other can easily be determined. - They show trends in data clearly, meaning that they visibly show how one variable is affected by the other as it increases or decreases. -They enable the viewer to make predictions about the results of data not yet recorded. Unfortunately, it is possible to alter the way a line graph appears to make data look a certain way. This is done by either not using consistent scales on the axes, meaning that the value in between each point along the axis may not be the same, or when comparing two graphs using different scales for each. It is important that we all be aware of how graphs can be made to look a certain way, when that might not be the way the data really is. Line Graphs Line graphs compare two variables. Each variable is plotted along an axis. A line graph has a vertical axis and a horizontal axis. So, for example, if you wanted to graph the height of a ball after you have thrown it, you could put time along the horizontal, or x-axis, and height along the vertical, or y-axis. Let's take a look at an example. In a few years, you might be interested in getting some kind of part-time job. You find the following line graph, which plots the minimum wage versus time from October, 1938, to September, 1997. What kinds of things might you be able to tell from it?
Teaching Students How to Interpret Line Graphs: Step One: Students should read the title and write what a graph is describing in their own words using complete sentences. Step Two: Students should then explain what is being described by each axis in complete sentences. They should find the label and the unit of measure on the horizontal axis (x-axis), and on the vertical axis (y-axis). Be sure to use the appropriate vocabulary with the students. If the label or unit of measurement is not apparent, the student needs to use the information in the title and/or any descriptions provided to determine this information. Be sure that students can identify the type of measurement units that are being used for each axis (days, weeks, number, of people, etc.) Marks on each axis must be evenly spaced and represent the same number of units between each line that is marked along the axis. Because the numbers on axes do not always start at 0, you will sometimes see a 0 followed by a zig- zag line which indicates a missing potion of the graph. Step 3: Students must mark data points with visible dots. These dots can then be labeled as an ordered pair (x-value, y-value). Step 4: Students should be able to create their own questions related to the graph. Ultimately the students need to be able to interpret and explain a line graph by identifying: The title The horizontal axis The vertical axis Relationship between the axes
Teaching Students How to Interpret Line Graphs: Step One: Students should read the title and write what a graph is describing in their own words using complete sentences. Step Two: Students should then explain what is being described by each axis in complete sentences. They should find the label and the unit of measure on the horizontal axis (x-axis), and on the vertical axis (y-axis). Be sure to use the appropriate vocabulary with the students. If the label or unit of measurement is not apparent, the student needs to use the information in the title and/or any descriptions provided to determine this information. Be sure that students can identify the type of measurement units that are being used for each axis (days, weeks, number, of people, etc.) Marks on each axis must be evenly spaced and represent the same number of units between each line that is marked along the axis. Because the numbers on axes do not always start at 0, you will sometimes see a 0 followed by a zig- zag line which indicates a missing potion of the graph. Step 3: Students must mark data points with visible dots. These dots can then be labeled as an ordered pair (x-value, y-value). Step 4: Students should be able to create their own questions related to the graph. Ultimately the students need to be able to interpret and explain a line graph by identifying: The title The horizontal axis The vertical axis Relationship between the axes Step 4:Students should be able to create their own questions related to the graph. Ultimately the students need to be able to interpret and explain a line graph by identifying: The title The horizontal axis The vertical axis Relationship between the axes
Labels and Titles Numerical Correctness Visual Presentation Evaluated by: Self Peer Teacher (Circle One) SCORING 13-14 = Advanced 11-12 = Proficient Comments: 8-10 = Needs Improvement _________Total Score0-7 = Failing
Labels and Titles Numerical Correctness Visual Presentation 4 Points Graph is titled appropriately Graph is labeled correctly and appropriately placed Answers to interpretive questions are labeled with correct units 8 Points Numerical data is placed correctly on the graph. Graph scaled appropriately (no awkward jumps in values). Answers to interpretive questions are correct and complete. 3 Points Graph is titled appropriately Most labels are correct and placed appropriately Answers to interpretive questions are labeled with correct units in most cases. 6 Points Numerical data is placed on the graph correctly in most cases. Graph scaled appropriately (no awkward jumps in values). Answers to interpretive questions are mostly correct and complete. Evaluated by: Self Peer Teacher (Circle One) SCORING 13-14 = Advanced 11-12 = Proficient Comments: 8-10 = Needs Improvement _________Total Score 0-7 = Failing
Reading Workshop on TOVANI’S I Read It But I Don’t Get It and Do I Really Have to Teach Reading?
What gets monitored is what gets done!!! For the students AND the teachers…
So, HOW do we know our teachers are implementing this? Collection of student work and formal and informal evaluation
As a follow up to this activity, I am requiring Department Heads to collect from each teacher at least one student sample from each of the teachers’ classes. The student samples should include: Student Name Teacher Name Date Course Name and Level Period A copy of the reading selection and question Evidence of the student’s active reading All pre-writing work that the student has done, e.g. webs A copy of the written open response The new scoring rubric and completed assessment After you have collected the samples from each teacher and have had the opportunity to review them for quality and completeness, please send them to me in a department folder with a checklist of your teachers. Again, please be sure that your teachers clearly label their student samples.
As a follow up to this activity, I am requiring Department Heads to collect from each teacher at least one student sample from each of the teachers’ classes. The student samples should include: Student Name Teacher Name Date Course Name and Level Period A copy of the reading selection and question Evidence of the student’s active reading All pre-writing work that the student has done, e.g. webs A copy of the written open response The new scoring rubric and completed assessment After you have collected the samples from each teacher and have had the opportunity to review them for quality and completeness, please send them to me in a department folder with a checklist of your teachers. Again, please be sure that your teachers clearly label their student samples. The student samples should include: Student Name Teacher Name Date Course Name and Level Period A copy of the reading selection and question Evidence of the student’s active reading All pre-writing work that the student has done, e.g. webs A copy of the written open response The rubric and completed assessment
As a follow up to this activity, I am requiring Department Heads to collect from each teacher at least one student sample from each of the teachers’ classes. The student samples should include: Student Name Teacher Name Date Course Name and Level Period A copy of the reading selection and question Evidence of the student’s active reading All pre-writing work that the student has done, e.g. webs A copy of the written open response The new scoring rubric and completed assessment After you have collected the samples from each teacher and have had the opportunity to review them for quality and completeness, please send them to me in a department folder with a checklist of your teachers. Again, please be sure that your teachers clearly label their student samples. After you have collected the samples from each teacher and have had the opportunity to review them for quality and completeness, please send them to me in a department folder with a checklist of your teachers. Again, please be sure that your teachers clearly label their student samples.
3 important criteria for collecting student work 1. Specify what you want and by when 2. Review the work using specific questions – - What is good enough? (use rubrics) - In what ways does this work meet or fail to meet the standard? - What do the student responses indicate about the effectiveness of the assignment? - How might the assignment be improved? - Did you find evidence of growth over time? - What did you notice about consistency across classes, departments, from teacher to teacher? 3. Provide feedback to the teacher
It’s about teaching, stupid… Mike Schmoker, Results Now