Download
1 / 38
380 likes | 398 Vues
Explore recent economic, social, education, and health data for Boone County, Indiana. Dive into indicators, workforce stats, poverty levels, and more to understand the community's landscape.

E N D
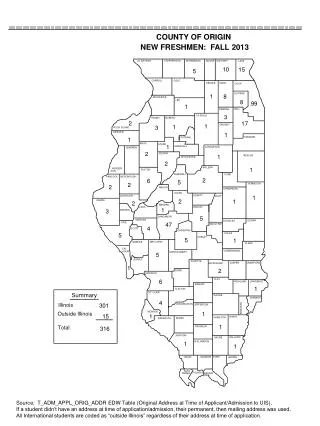
Community Foundation of Boone County Summary of Recent Economic, Social, Education and Health Data September 2013
Boone County “Grades” and Scores (Possible 100) Center For Business and Economic Research Ball State University Indiana Community Asset Inventory and Rankings 2012 • No letter grade given • In this case static means unchangeable – i.e., no beaches or mountains is a negative but not a lot you can do about it.
Unemployment RateJuly 1990 through July 2013 Indiana Business Research Center – STATS Indiana
Median Household Income(Not Adjusted for Inflation – An Inflation Adjustment for this period would reduce the 2011 figures by about 20% and would be significantly below the 2002 level) KidsCount & U.S. Census Small Area Income Estimates
Per Capita Income(Not Inflation Adjusted) The Annie E. Casey Foundation, KIDS COUNT DataCenter, datacenter.kidscount.org
Median Household Income American Community Survey 2007-2011 5-Year Average
Median Family Income American Community Survey 2007-2011 5-Year Average
Median Family IncomeAnd Percentage of Persons Over Age 24 with Bachelors Degree or Higher American Community Survey 2007-2011 5-Year Average 12.1 - 16.9% 22.4 - 27.4% 39.4 - 39.4% 56.9 - 56.9% 69.3 - 71.5%
Percentage of Families Below Federal Poverty Level Boone County 6.3% Hendricks County 3.7% American Community Survey 2007-2011 5-Year Average
Percentage of Families with Children Under 18 Below Federal Poverty Level Boone County 9.1% Hendricks County 5.4% American Community Survey 2007-2011 5-Year Average
Sheridan Western Boone Lebanon Zionsville Percentage of Households With Children Under 18 and Headed by A Single Female That Are Under Federal Poverty LevelSchool Districts Boone County 43%% Hendricks County 18.2% American Community Survey 2007-2011 5-Year Average
The Impact Of Family Structure On Poverty*In A Two-Earner Economy *As measured by the Federal Poverty Guidelines
Percentage Of Households ReceivingSupplemental Nutrition Assistance Program Benefits (SNAP) Boone County 4.6% Hendricks County 2.8% American Community Survey 2007-2011 5-Year Average
Percentage of Rental Households With Rental Costs 35% or More of Income Boone County 38.2% Hendricks County 31.9% American Community Survey 2007-2011 5-Year Average
Percentage Of Students Receiving Free or Reduced Price Lunches At School
Quick Comparison of Federal Poverty Guidelines and Self-Sufficiency Standard (These are for 2009 – the most recent available for the Self-Sufficiency Standard)
Housing and Wages One way to look at economic self-sufficiency is to consider earnings needed to rent an apartment without exceeding a limit of 30% of income for housing costs.
Needs Data From Connect2Help 2-1-1 July 2012 – June 2013 • In Boone County, as everywhere else, • the most prevalent human service needs derive from one primary factor – inadequate financial resources. • But, underlying this are multiple causes: • Unemployment/Underemployment • Lack of Education/Skills • Medical Conditions/Disabilities • Mental Health and Addictions • Transportation • Access to Childcare Top Five Caller Needs Top Five Unmet Needs The top 5 referrals for Boone County callers were: The Caring Center, CAGI, Center Township Trustee, Boone County Division of Family Resources
Percentage of Households Consisting of A Person Over Age 65 Living Alone Boone County 9.2% Hendricks County 7.6% American Community Survey 2007-2011 5-Year Average
Projected Share of Boone County PopulationSchool Age Children and Seniors2010 to 2050 Source: STATS Indiana, using data from the Indiana Business Research Center, IU Kelley School of Business
Percentage Of Persons Over Age 24 With High School As Highest Educational Attainment Boone County 28.6% Hendricks County 31.8% American Community Survey 2007-2011 5-Year Average
Percentage Of Persons 25 and Over with Bachelor Degree or Higher And Percentage of Students Passing All ISTEP 2012 75% 79.2% 78.1% 91.3% American Community Survey 2007-2011 5-Year Average and Indiana Department of Education
Boone and Hendricks County Schools plus Sheridan Indiana Department of Education 2012 ISTEP Data Schools With Boone County Students
Percentage of Third Grade Elementary Students Passing Both Parts of 2012 ISTEP Compared With Percentage of Students Receiving Free or Reduced Lunch Indiana Department of Education
Percentage of Elementary Students Passing All Parts of ISTEP 2012 Free or Reduced Price Lunch Compared With Paid Lunch Students (Eagle & Zionsville Pleasant Not Sufficient Numbers to Calculate Rate) Indiana Department of Education
Licensed Childcare Center “Slots” per 1000 Children 0 to 4 The Annie E. Casey Foundation, KIDS COUNT DataCenter, datacenter.kidscount.org
Percentage Of Childcare Facilities That Are Licensed Centers The Annie E. Casey Foundation, KIDS COUNT DataCenter, datacenter.kidscount.org
Percentage of Children Under Age Six With All Parents In Labor Force (Single and Two-Parent Households) Boone County 73.2% = 3,425 Children Under 6 Hendricks County 70.7% American Community Survey 2007-2011 5-Year Average
2012 Community Health Needs Assessment ReportBoone County Compared With Benchmarks • Boone County compares quite favorably with Indiana on most of the health benchmarks and exceeds or meets many of the 2020 Healthy People national goals • The exceptions in comparison to Indiana are: • Alzheimer’s death rate • Female breast cancer and prostate cancer. • Current drinkers • Has not yet met 2020 Healthy People goals for: • Percent without health insurance and with source of ongoing care • Incidence of most forms of cancer – especially female breast cancer and prostate cancer. • Any of the immunization and infectious disease benchmarks • Motor vehicle crash death rates • Heart disease, stroke, high blood pressure, high cholesterol • Smoking
2012 Community Health Needs Assessment Report Although the Assessment suggests that good health is prevalent in Boone County, the more detailed findings which include data for various population segments show that, despite an overall positive situation, some groups, particularly those with lower income, do not fare as well. Some of the factors with significant disparities are highlighted below. . Assessment Prepared for Witham Health ServicesProfessional Research Consultants, Inc.
Boone County Community Clinic’s H.E.R.S. for HerParticipant Survey A survey of very-low income (<$15,000/yr) Boone County Community Clinic’s H.E.R.S. for Her participants further highlights health issues among this population. • For example, they reported the following medical conditions or problems: • Overweight 63% • Symptoms of stress 39% • Symptoms of depression 46% • Smoking 73% • Up to date on women’s 40% • health checkups • Without public or private health 52% • insurance • Without current health provider 41% Average age of participants surveyed 28 Percentage single or divorced 79% Percentage with high school education or less 80% Percentage with children 63%
Thank You Questions?