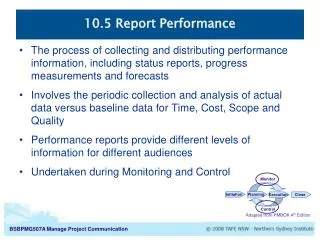
Performance Report
This comprehensive performance report summarizes the activities and outcomes of the Student Managed Fund from September 24, 2004, to February 11, 2005. It highlights an additional $500,000 added to the portfolio on January 19, 2005, and discusses the robust investment methodology, portfolio performance, and economic outlook. The fund primarily invested in large-cap stocks, using a combination of value and growth strategies. Key performance insights, stock selection criteria, and sector allocation details are provided, showcasing the fund's superior performance relative to the S&P 500.

Performance Report
E N D
Presentation Transcript
Performance Report Student Managed FundMBA class of 2005March 3, 2005
Christophe Pane Luis Prandini Stephen Petretto Igor Lemagic Rajiv Iyer MBA Fund Managers • Jie Wan • Ashley Martella • Yun Cai • Amit Kumar • Sampita Ray • Gabriel Joanes
Performance Highlights (Sept 24,2004 thru February 11,2005) *An additional $500,000 was added to the portfolio as of Jan,19 2005. **Based on risk-free rate of 4.2%.
Agenda • Investment Methodology • Portfolio Performance & Attribution Analysis • Economic Outlook and Allocation
Investment Strategy and Style • Blend Strategy • Combination of value and growth • Multi-Cap Fund Market Capitalization Small Caps 1 stock Large Caps 23 stocks Mid Caps 5 stocks Number of holdings as of 02/25/05: 29 • Primarily investments in large-cap stocks
Investment Philosophy • Fundamental analysis • Historical performance • Valuation models • Business models • Future Prospects • Economic outlook for the industry • Long-term (3-5 year) investment horizon • Benchmark: S&P500 Index • Selecting stocks with potential • Close monitoring of the portfolio
Investment Approach Top Down Approach Sector Allocation Stock Selection • Valuation Models • PEG and P/E Models • Dividend Discount Model • Free Cash Flow Model • Fundamental Analysis • Business Model Analysis • Ratio Analysis • Future Prospects
Stock Selection Criteria • We look for: • Solid financials • Strong management • Earnings growth • Attractive valuation relative to peers • Higher return/risk relative to industry “If the choice is between a questionable business at a comfortable price or a comfortable business at a questionable price, we much prefer the latter.”
Buy Criteria • Steady growth rates • Intrinsic value > market value • Above average expected returns • Sell Review Criteria • Stock reaches our target return • Predetermined stop loss prices • Risk/reward profile deteriorates • Actual earnings figures lower than estimates Buy & Sell Discipline
Management Style • Active Management • Report presentation and voting • Performance Monitoring • Stop Loss Measures (15%) • Appreciation Reevaluation (20%) • Continuous Monitoring & Dynamic Response
Sector Allocation (as of 02/11/2005) Top 5 sectors: Financials Industrials Consumer Disc. IT Health Care
Detailed Sector Allocation (as of 02/11/2005) * Best Performer until 02/11
Performance Highlights (Sept 24,2004 thru February 11,2005) *An additional $500,000 was added to the portfolio as of Jan,19 2005. **Based on risk-free rate of 4.2%.
Portfolio Performance Attribution Period: September 24, 2004 to February 11, 2005 Excess Return = Stock Selection + Sector Allocation + Cash Position
Current State of the SMF Portfolio (since Feb. 11) • Positions Added: • Apache Corporation, PetroChina (Energy) • Ameritrade, E*Trade, MBNA (Financials) • Invitrogen (Health Care) • Sysco Foods (Consumer Staples) • Dunn & Bradstreet, Tyco International (Industrials) • Florida Power & Light Group, Inc. (Utilities) • Positions Increased: • Comcast and Starwood Hotels (Consumer Discretionary) • Hartford Financial Services (Financials)
Portfolio Summary • Market Value at Feb. 25, 2005: $967,397 • Current number of stocks: 29 • Total amount yet to be allocated: $160,653 • Top 10 holdings: • Apache Corporation – 4.43% • Dun & Bradstreet – 4.45% • Tyco International – 4.24% • Hartford Financial Services – 4.12% • E*Trade - 4.07% • FPL Group - 4.06% • MBNA Corporation - 4.04% • Invitrogen Corp. – 3.97%
Portfolio Summary • Top 10 holdings: • Commerce Bancorp – 3.72% • Sysco Foods – 3.63%
Economic Outlook • Expected GDP growth of over 3% for 2005, albeit lower than 2004. • Core Inflation expected to rise; prices rose 2.3% from a year earlier. • Long-term interest rates are still low; flattening yield curve. • Federal Reserve is expected to continue increasing the federal-funds rate at “measured” pace. • Mergers-and-acquisitions market is picking up steam – favorable development for equities. • Situation in Iraq puts pressure on oil price and maintain high level of uncertainty. • Energy,industrials,materials, utilities expected to lead market.
WRAP UP • Fulfilled Portfolio Objectives • Performance surpassed S&P 500 • Lower Risk Level • Invested primarily in Large Cap U.S. Equities • Chose only fundamentally strong companies Top Performers Aetna (AET)-49.31% Valero (VLO)-39.61% Hartford (HIG)-18.97% Worst Performers Cisco (CSCO)- (9.23%) Pfizer (PFE)- (16.83%) CACI (CAI)- (16.98%)
Takeaways • Valuation Highly Dependent on Analyst’s Assumptions • Stop Losses can sometimes work against you • Have patience • Stick to your strategy and convictions • Enjoy the extraordinary learning opportunity
Thank you. • University of Connecticut Foundation Inc. • Investment Advisory Board • Dr. Chinmoy Ghosh