Year
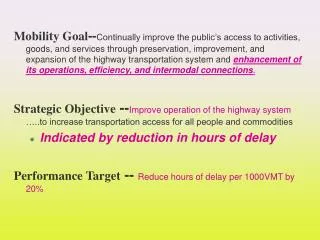
Mobility Goal -- Continually improve the public’s access to activities, goods, and services through preservation, improvement, and expansion of the highway transportation system and enhancement of its operations, efficiency, and intermodal connections .

Year
E N D
Presentation Transcript
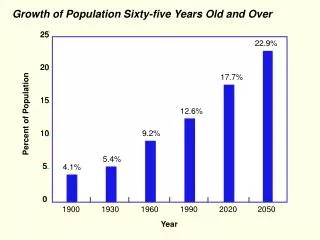
Mobility Goal--Continually improve the public’s access to activities, goods, and services through preservation, improvement, and expansion of the highway transportation system and enhancement of its operations, efficiency, and intermodal connections. Strategic Objective --Improve operation of the highway system …..to increase transportation access for all people and commodities • Indicated by reduction in hours of delay Performance Target -- Reduce hours of delay per 1000VMT by 20%
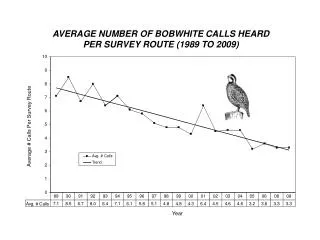
Delay (hours/ 1000 vehicle miles Year 19938.3 1994 8.5 1995 9.3 1996 9.2 1997 9.0 1998 N/A 1999 N/A Performance Target 2000: 9.0
Is Hours of Delay the best measure? • Probably not the only one • Others: • Congestion Index • Predictability or Reliability • Throughput • Travel Time • Accessibility • Consumer Satisfaction • Topic for Field Operations Council
Will Improving Operations Make a Difference? 65% reduced clearance time 35% fewer crashes Reduction in travel time Incident Management Signal Timing/Control Ramp Metering 8% - 25% 8 - 60% increase in speed Traveler Information 50% of Travelers change route 45% of Travelers change departure time Seattle MMDI Web use doubled in 8 months, tripled in severe weather
What Stands in the Way? 1. Fragmented Institutions 2. Culture and Underlying Policy defined by • Problem Solving • Completing a Project
Strategy • 1. Top Down: ITS Infrastructure Deployment • 2. Bottom Up: Expand on what we do well • (Low Hanging Fruit) • 3. Amplify the Customer • 4. Lay a Foundation for Art and Science • of Operations Top Down Deployment Bottom up
Top Down: Deploying ITS Infrastructure • Architecture - Convenes Operations Stakeholders • Concept of Operations - Regional Operations Plan • Infrastructure itself enables Operations • Focus: • Transfer leadership to field • Standards Testing and Guidance • Tool Development
Interim Goal: • INTEGRATEDITS Infrastructure in • 75 Metro Areas • 25 States • By the end of TEA-21
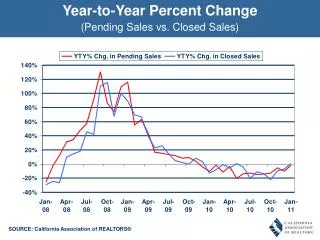
100% 90% 80% 70% 60% Percent of Deployment Opportunity 50% 43% 36% 40% 23% 22% 23% 30% 17% 18% 15% 11% 20% 5% 10% 0% Incident Management - Freeway Incident Management - Arterial Freeway Management Transit Management Traffic Signal Control Emergency Management Electronic Fare Payment Electronic Toll Collection Highway Rail Intersections Regional Multimodal Traveler Information How are we Doing? Infrastructure
100% 90% 80% 70% 57% 60% 51% 50% 100% Percent of Deployment Opportunity 50% 90% 34% 37% 32% 40% 80% 33% 25% 70% 30% Percent of Deployment Opportunity 17% 60% 100% 20% 90% 50% 7% 80% 10% 40% 0% 70% 60% 0% 30% 24% No Toll Collection 50% Percent of Deployment Opportunity 50% 14% 20% 35% 40% 7% 8% 25% 30% No Toll Collection 10% 2% 22% 0% 0% 0% 17% 0% 0% 14% 20% 0% 10% 1% 0% 0% 0% 0% Comparison High Low Medium
Expand What We Do Well (Low Hanging Fruit) • Reducing Work Zone Delay • -Bringing Operations in at Planning Stage • -Valuing Delay • -Legacy Traffic Management - Building Smart Roads • Weather Response • Incident Management • Emergency Management/Response • Special Event Planning • Arterial Signal Control
Amplify the Customer • National measures of how well the system operates • Monitored and reported nationally and locally • Consumerappetite for Traffic information growing • -N11 will drive more surveillance
Lay a Foundation Lay a Foundation for Art and Science of Operations • Benchmarking • -State of art • -State of Practice • -Norm • -Gaps • Constituency Building
Freight Mobility and Productivity Goals Mobility: Continuously improve the public’s access to activities, goods and services through preservation, improvement and expansion of the highway transportation system and enhancement of its operation, efficiency, and intermodal connections. Productivity: Continuously improve the economic efficiency of the Nation’s transportation system to enhance America’s position in the global economy.
Performance Goals • Under Mobility: • We have set the additional performance goal of improving the efficiency and capacity of existing intermodal connections on the NHS and serving new intermodal facilities • Under Productivity: • We have set the additional performance goal of reducing the cost of highway freight per ton mile • We have set a correlated performance goal of reducing the hours of delay per 1000 vehicle processed at NHS border crossings
Are these the right measures? How do we measure and monitor? Measures • Hours of Delay • Cost Per ton Mile • -Target? • Reduce Hours of Delay at Border Crossings • -Data? • -Target? • Intermodal Connector Efficiency??
ISTEA Studies: Diagnosed Issues and Problems • Institutional Issues • Leveling planning process to better reflect freight geography • Conflicting standards • Lack of institutions for multi-state trade corridors
ISTEA Studies: Diagnosed Issues and Problems .. cont. • Infrastructure Issues • Adequacy of the physical condition of the system • for freight and defense • Impact of future demand and shifting load centers • What are the economic benefits of freight investments? • Effectiveness of funding mechanisms
ISTEA Studies: Diagnosed Issues and Problems .. cont. • Operations Issues • Information and communications standards • Technology applications to multi state corridors • Compatible business practices • Hazardous goods movement
ISTEA Studies: Diagnosed Issues and Problems .. cont. • Regulatory Issues • Standardization of freight vehicle and equipment • Balance of productivity and environmental goals • Conflicting city and state regulations
Strategies • 1. Develop Freight Investment decision-making framework • 2. Nurture multi-state freight/trade institutional partnerships • 3. Directly invest in corridor & border improvements • 4. Test ITS Application
FHWA Freight Productivity Program Institutional/Planning Freight Financing FHWA Freight Review FHWA North American Strategy Freight Planning Freight Improvement Strategies Institutional, Funding Strategies, Planning Options, Institutions, etc…. Freight Partnerships International Initiatives Freight Performance Measures Infrastructure NHS Connector & Follow On Marine Transport System Intermodal Freight Analysis/Decision Framework Intermodal Freight Capacity Analysis Chicago Area Study Re-Authorization Revised FHWA investment models Operations & Safety International Border Clearance Program Intermodal Freight Technology Group ITS Intermodal Op Tests Economic Benefits of Freight Corridor/Border (1118/1119) Regulatory Size & Weight Environmental Review Intermodal Equipment Other Freight Regulations
2. Nurture Multi State Partnerships Coordinate transportation planning, project development, system operations, and/or investment Link state transportation agencies with Federal Inspection Services (Ag, Customs, INS, State) and international bridge owners/operators, usually binational Promote economic development by consensus building, consciousness raising, creating linkages between economic development and transportation, etc.
Examples • Eastern Border Coalitions • Canadian Border Trade Alliance • Pacific Northwest Economic Region • Western Trade Network • SASHTO Latin American Trade Study • I-95 Coalition • I-10 Corridor • Ontario Michigan Gateway (others)
3. Direct Investment in Border & Corridor Improvement Multi-State Projects -11 Border Projects -24 $57.2 million ITS Projects -10 $12.2. million
4. Develop & Test ITS Applications • International Border Clearance Program • End to End Process Analysis for Container Movement • Architecture Development • Standards
Coordination Across the Agency • Field Operations Council • -Jeff Lindley, Council • -Virtual Group • -Steering Committee Meets 3 times a week • Headquarters Operations Council • NAFTA Council
PERFORMANCE MEASURES AND MEASURES OF SUCCESS Goals Mission Vision Performance Measures Adequate Performance Measures Non-Existent Customer Survey Literature Survey & Bench Marks Internal Sources Other States TRIS AASHTO NAWG BTS ITE Candidate List of Measures of Effectiveness (MOE) MOE Validation Paper Operational Test Final MOE Selection Targets