Understanding Market Forecasting: Methods and Applications for Sales Potential Estimation
This document explores the methods and applications of market forecasting, particularly in estimating sales and market potential for new and existing products. It covers various forecasting techniques, including judgment-based, customer-based, and time-series methods. Key decision-making uses are outlined, such as resource allocation, performance evaluation, and production planning. The role of secondary and primary data sources like government reports and surveys is also emphasized. By understanding these methods, businesses can make informed decisions about product launches and market strategies.


Understanding Market Forecasting: Methods and Applications for Sales Potential Estimation
E N D
Presentation Transcript
Major Uses of Potential Estimates • To make entry / exit decisions • To make resource level decisions • To make location and other resource allocation decisions • To set objectives and evaluate performance • As an input to forecasts
Deriving Potential Estimates Data Secondary data Calculations Result Past sales data Model/Statistical method Potential estimate Surveys/ Primary data Judgment Secondary sources
Useful Sources for Potential Estimates • Government Sources • Trade Associations • Private Companies • Financial and Industry Analysts • Popular Press • The Internet
New or Growing Product Potential • Relative Advantage • Is the new product superior in key benefits? • To what degree? • Compatibility • What level of change is required to understand and use a new product? • For customers? Intermediaries? The company? • Risk • How great is the risk involved? • What is the probability someone will buy a new product?
Methods of Estimating Market and Sales Potential • Analysis-Based Estimates • Determine the potential buyers or users of the product • Determine how many are in each potential group of buyers defined by step 1 • Estimate the purchasing or usage rate
How Are Sales Forecasts Used? • To answer “what if” questions • To help set budgets • To provide a basis for a monitoring system • To aid in production planning • By financial analysts to value a company
Judgment-based Forecasting Methods • Naïve extrapolation • Sales force composite • Jury of expert opinion • Delphi method
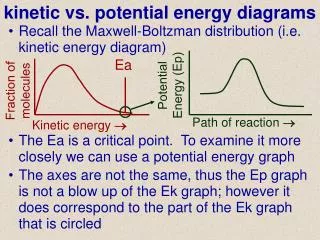
Graphical Eyeball Forecasting Sales ƍ Range • • Forecast • • • • • • • • Time
Customer-Based Forecasting Methods • Market testing • Situations in which potential customers are asked to respond to a product concept • Mall Intercept Surveys • Focus Groups • Market surveys • A form of primary market research in which potential customers are asked to give some indication of their likelihood of purchasing a product
Time-Series Forecasting Methods • Moving Averages • Exponential Smoothing • Regression Analysis
Time-Series Extrapolation Sales s = 85.4 + 9.88 (time) • 174.5 • • • • • • • • • 1 • 12 • • • • • Time
Time-Series Regression Example Input Data Time Sales • 100 • 110 • 105 • 130 • 140 • 120 • 160 • 175 Prediction Ŝ Computer/ Calculator 94.3 105.2 115.0 124.9 134.8 144.7 154.6 164.4 Sales=85.4+9.88(time)
Trial over Time for a New Product Number who try a new product for first time Time
Model-Based Methods • Regression analysis • Leading indicators • Econometric models
Use of New Product Forecasting Techniques by All Responding Firms
Developing Regression Models • Plot Sales Over Time • Consider the Variables that Are Relevant to Predicting Sales • Collect Data • Analyze the Data • Examine the correlations among the independent variables • Run the regression • Determine the significant predictors
Cereal Data Correlation Matrix* The numbers in each cell are presented as: correlation, (sample size), significant level
Regression Results: Cereal Data* Numbers in ( ) are standard errors