Data Systems Quality
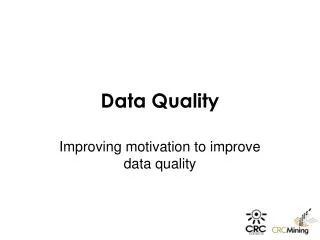
Data Systems Quality. Implementing the Data Quality Assessment Tool. Session Overview. Why data quality matters Dimensions of data quality Thoughts about improving data quality Data Quality Assurance Tool Activity: Implementing the Tool. Data Quality. Data Management System

Data Systems Quality
E N D
Presentation Transcript
Data Systems Quality Implementing the Data Quality Assessment Tool
Session Overview • Why data quality matters • Dimensions of data quality • Thoughts about improving data quality • Data Quality Assurance Tool • Activity: Implementing the Tool
Data Quality Data Management System An information system represents these activities by collecting the results that were produced and mapping them to a recording system. The REAL world In the real world, project activities are implemented in the field. These activities are designed to produce results that are quantifiable. Data Quality: How well the DMS represents the real world Data Management System ? Real World
Testing and Counseling: How are these data collected? • A person walks into the facility • Facility registration • How aggregated at facility level? • How forwarded to next level? • How forwarded to national level? • How forwarded to international level?
ARV Treatment: How are these data collected? • A person tests positive for HIV • When begin receiving ARV? • How recorded in facility records? • How aggregated at facility level? • How aggregated at next level? • How aggregated at national level? • How aggregated at international level?
OVC Care: How are these data collected? • A child is identified as being an orphan or vulnerable—how? • Receives care from an organization—which ones? How many? • How recorded at organizational level? • How aggregated at next level? • How aggregated at national level? • How aggregated at international level? • How do we know that child did not receive care from more than one organization?
Why is data quality important? • Governments and donors collaborating on “Three Ones” • Accountability for funding and results reported increasingly important • Quality data needed at program level for management decisions
Data quality and PEPFAR/GFATM Data Quality Results Reporting
Data Quality REAL WORLD In the real world, project activities are implemented in the field. These activities are designed to produce results that are quantifiable. INFORMATION SYSTEM An information system represents these activities by collecting the results that were produced and mapping them to a recording system. Data Quality: How well the information system represents the real world Data Quality 1. Accuracy 2. Reliability 3. Completeness 4. Precision 5. Timeliness 6. Integrity Real World Information System
Validity/Accuracy: Questions to ask… • What is the relationship between the activity/program & what you are measuring? • What is the data transcription process? • Is there potential for error? • Are steps being taken to limit transcription error • double keying of data for large surveys, built in validation checks, random checks
Reliability: Questions to ask… • Is the same instrument used from year to year, site to site? • Is the same data collection process used from year to year, site to site? • Are procedures in place to ensure that data are free of significant error and that bias is not introduced (e.g., instructions, indicator reference sheets, training, etc.)?
Reliability: Questions to ask… • If there are data errors, what do you do with that information? • If raw data need to be manipulated, are the correct formulae being applied—across site and consistently? • How to handle missing/incomplete data? • Are final numbers reported accurately—does the total add up?
Completeness: Questions to ask • Are the data from all sites that are to report included in aggregate data? • If not, which sites are missing? • Is there a pattern to the sites that were not included in the aggregation of data? • What steps are taken to ensure completeness of data?
Precision: Questions to ask… • How is margin of error being addressed? • Are the margins of error acceptable for program decision making? • Have issues around precision been reported? • Would an increase in the degree of accuracy be more costly than the increased value of the information?
Timeliness: Questions to ask… • Are data available on a frequent enough basis to inform program management decisions? • Is a regularized schedule of data collection in place to meet program management needs? • Are data from within the policy period of interest (i.e. are the data from a point in time after the intervention has begun)? • Are the data reported as soon as possible after collection?
Integrity: Questions to ask… • Are there risks that data are manipulated for personal or political reasons? • What systems are in place to minimize such risks? • Has there been an independent review?
During this workshop, think about… • How well does your information system function? • Are the definitions of indicators clear and understood at all levels? • Do individuals and groups understand their roles and responsibilities? • Does everyone understand the specific reporting timelines—and why they need to be followed?
…Keep thinking about… • Are data collection instruments and reporting forms standardized and compatible? Do they have clear instructions? • Do you have documented data review procedures for all levels…and use them? • Are you aware of potential data quality challenges, such as missing data, double counting, lost to follow up? How do you address them? • What are your policies and procedures for storing and filing data collection instruments?
Data Quality Assessment Tool For Assessment & Capacity Building
Purpose of the DQA The Data-Quality Assessment (DQA) Protocol is designed: • to verify that appropriate data management systems are in place in countries; • to verify the quality of reported data for key indicators at selected sites; and • to contribute to M&E systems strengthening and capacity building.
Determine scope of the data quality assessment Suggested criteria for selecting Program/project(s) & indicators Engage Program/project(s), obtain authorization for DQA Templates for notifying the Program/project of the assessment Guidelines for obtaining authorization to conduct the assessment Assess the design & implementation of the Program/project’s data collection and reporting systems. Steps & protocols to ID potential threats to data quality created by Program/project’s data management & reporting system DQA Components
DQA Components • Trace & verify (recount) selected indicator results • Protocol with special instructions based on indicator & type of Service Delivery Site (e.g. health facility or community-based) • Develop and present the assessment Team’s findings and recommendations. • instructions on how and when to present the DQA findings • recommendations to Program/project officials for how to plan for follow-up activities to ensure strengthening measures are implemented
Chronology and Steps of the DQA PHASE 5 PHASE 1 PHASE 2 PHASE 3 PHASE 4 PHASE 6 Preparation and Initiation (multiple locations) M&E Management Unit Service Delivery Sites / Organizations Intermediate Aggregation levels (eg. District, Region) M&E Management Unit Completion (multiple locations) Assess Data Management and Reporting Systems Draft initial findings and conduct close-out meeting Draft and discuss assessment Report Select Indicators and Reporting Period Select/Confirm Service Delivery Points to be visited Trace and Verify Reported Results Obtain National Authorizations and notify Program Initiate follow-up of recommended actions • The DQA is implemented chronologically in 6 Phases. • Assessments and verifications will take place at every stage of the reporting system: • M&E Management Unit • Intermediate Aggregation Level (Districts, Regions) • Service Delivery Sites.
Completed protocols and templates Part DQA Tool. Write-ups of observations, interviews, and conversations Key data quality officials at the M&E Unit Intermediary reporting locations & Service Delivery Sites Preliminary findings, draft recommendations notes Based on evidence collected in protocols Final assessment Report Summarizes evidence collected IDs specific assessment findings & gaps related to evidence Includes recommendations to improve data quality directly linked to assessment findings Summary statistics calculated from systems & data verification protocols DQA Outputs
DQA Outputs • Strength of the M&E System • Evaluation based on review of data management & reporting system including summary responses on system design & implementation • Verification Factors • Generated from trace & verify recounting exercise performed on primary records/aggregated reports • % comparison of reported numbers to the verified numbers • Available, timely & complete reports percentages • Calculated at Intermediate aggregation level and the M&E unit • Summary stats developed from systems & data verification protocols • All follow-up communication with program/project related to results and recommendations of DQA
PHASE 2 PHASE 3 PHASE 4 M&E Management Unit Service Delivery Sites / Organizations Intermediate Aggregation levels (eg. District, Region) PROTOCOL 1: Assessment of Data Management and Reporting Systems Assess Data Management and Reporting Systems • Purpose • ID potential risks to data quality created by data management & reporting systems at: • M&E Management Unit; • Service Delivery Points; • Intermediary Aggregation Levels (District or Region) • The DQA assesses both design and implementation of data-management & reporting systems. • Assessment covers 8 functional areas (HR, Training, Data Management Processes , etc.)
PHASE 2 PHASE 3 PHASE 4 M&E Management Unit Service Delivery Sites / Organizations Intermediate Aggregation levels (eg. District, Region) PROTOCOL 2: Trace and verify Indicator Data Trace and Verify Reported Results • PURPOSE: Assess on limited scale if Service Delivery Points and Intermediate Aggregation Sites are collecting & reporting data accurately and on time. • Trace and verification exercise - two stages: • In-depth verifications at the Service Delivery Points; and • Follow-up verifications at the Intermediate Aggregation Levels (Districts, Regions) and at the M&E Unit.
District 3 District 2 District 1 Monthly Report Monthly Report Monthly Report District 4 Monthly Report District 1 TOTAL SDS 3 District 3 SDS 1 SDS 2 District 4 TOTAL SDP 5 SDP 6 SDS 4 TOTAL District 2 45 20 50 200 45 65 75 45 250 75 75 250 45 TOTAL 65 Service Delivery Site 4 Service Delivery Site 5 Service Delivery Site 2 Service Delivery Site 3 Monthly Report Monthly Report Monthly Report Monthly Report ARV Nb. 75 ARV Nb. ARV Nb. ARV Nb. 45 20 50 Source Document 1 Source Document 1 DQA Protocol 2: Trace and Verification M&E Unit/National Monthly Report TOTAL 435 Service Delivery Site 1 Service Delivery Site 6 Monthly Report Monthly Report ARV Nb. 45 ARV Nb. 200 Source Document 1 Source Document 1 Source Document 1 Source Document 1
1- VERIFICATION FACTOR (% difference in the reported / re-aggregated numbers) 100% 2- AVAILABILITY, COMPLETENESS ANDTIMELINESS OF REPORTS 55,3% (26,654 Unaccounted) 67% Missing 33% Available 80% Availability 60% 41% Incomplete 69% Complete 44,7% (21,449 Recounted) Completeness * 40% No tracking of timeliness Timeliness 20% 20% 40% 60% 80% 100% * Report has to include (1) Name of site; (2) Reporting Period; (3) Name of submitting person; (4) Cumulative data. Illustration 1 - Trace and Verification at the M&E Unit (HIV/AIDS) Number of patients on ARV - 31st of August 2006
Illustration 3 – Systems’ Finding at the M&E Unit (HIV/AIDS)
Findings from DQAs • Data not collected routinely - ‘reporting flurry’ • Documentation of what was reported (can’t locate source documents/lack of filing system for easy retrieval) • Issues around double-counting • Integrity – incentives for over-reporting • Effect of staff turnover • Involving staff in M&E – definitions of indicators, value of data, data use
MEASURE Evaluation is a MEASURE project funded by the U.S. Agency for International Development and implemented by the Carolina Population Center at the University of North Carolina at Chapel Hill in partnership with Futures Group International, ICF Macro, John Snow, Inc., Management Sciences for Health, and Tulane University. Views expressed in this presentation do not necessarily reflect the views of USAID or the U.S. Government. MEASURE Evaluation is the USAID Global Health Bureau's primary vehicle for supporting improvements in monitoring and evaluation in population, health and nutrition worldwide.