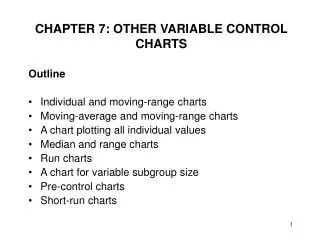
CHAPTER 7: OTHER VARIABLE CONTROL CHARTS
CHAPTER 7: OTHER VARIABLE CONTROL CHARTS. Outline Individual and moving-range charts Moving-average and moving-range charts A chart plotting all individual values Median and range charts Run charts A chart for variable subgroup size Pre-control charts Short-run charts.

CHAPTER 7: OTHER VARIABLE CONTROL CHARTS
E N D
Presentation Transcript
CHAPTER 7: OTHER VARIABLE CONTROL CHARTS Outline • Individual and moving-range charts • Moving-average and moving-range charts • A chart plotting all individual values • Median and range charts • Run charts • A chart for variable subgroup size • Pre-control charts • Short-run charts
Individual and Moving-Range Charts • This chart is useful when number of products produced is too small to form traditional charts and data collection occurs either once a day, or on a week-to-week or month-to-month basis • The individual measurements are taken and plotted on the individual chart • Two consecutive individual data-point values are compared and the absolute value of their difference is recorded on the moving-range chart. The moving-range is usually placed on the R chart between the space designated for a value and its preceding value.
Individual and Moving-Range Charts • Formula:
Individual and Moving-Range Charts • Interpretation of individual and moving-range charts is similar to that of charts. • Once the process is considered in control, the process capability can be determined. • Individual and moving-range charts are more reliable when the number of samples taken exceeds 80.
Text Problem 7.1: Create a chart for individuals with a moving range for the measurements given below. (Values are coded 21 for 0.0021 mm.) After determining the limits, plotting the values, and interpreting the chart, calculate using Is the process capable of meeting the specifications of 0.00250.0005 mm? 21 22 22 23 23 24 25 24 26 26 27 27 25 26 23 23 25 25 26 23 24 24 22 23 25
Moving-Average and Moving-Range Charts • and R charts track the performance of processes that have long production runs or repeated services. • Sometimes, there may be insufficient number of sample measurements to create a traditional and R chart. • For example, only one sample may be taken from a process. • Rather than plotting each individual reading, it may be more appropriate to use moving average and moving range charts to combine n number of individual values to create an average.
Moving-Average and Moving-Range Charts • When a new individual reading is taken, the oldest value forming the previous average is discarded. • The range and average are computed from the most recent n observations. • This is quite common in continuous process chemical industry, where only one reading is possible at a time.
Moving-Average and Moving-Range Charts • Use for continuous process chemical industry: The moving average is particularly appropriate in continuous process chemical manufacture. The smoothing effect of the moving average often has an effect on the figures similar to the effect of the blending and mixing that take place in the remainder of the production process. • Use for seasonal products: By combining individual values produced over time, moving averages smooth out short term variations and provide the trends in the data. For this reason, moving average charts are frequently used for seasonal products.
Moving-Average and Moving-Range Charts • Interpretation: • a point outside control limits • interpretation is same as before - process is out of control • runs above or below the central line or control limits • interpretation is not the same as before - the successive points are not independent of one another
Text Problem 7.6 (7.4): Eighteen successive heats of a steel alloy are tested for RC hardness. The resulting data are shown below. Set up control limits for the moving-average and moving-range chart for a sample size of n=3. Heat Hardness Average Range Heat Hardness Average Range 1 0.806 10 0.809 2 0.814 11 0.808 3 0.810 12 0.810 4 0.820 13 0.812 5 0.819 14 0.810 6 0.815 15 0.809 7 0.817 16 0.807 8 0.810 17 0.807 9 0.811 18 0.800
Example: Eighteen successive heats of a steel alloy are tested for RC hardness. The resulting data are shown below. Set up control limits for the moving-average and moving-range chart for a sample size of n=3. Heat Hardness Average Range Heat Hardness Average Range 1 0.806 10 0.809 0.810 0.002 2 0.814 11 0.808 0.809 0.003 3 0.810 0.810 0.008 12 0.810 0.809 0.002 4 0.820 0.815 0.010 13 0.812 0.810 0.004 5 0.819 0.816 0.010 14 0.810 0.811 0.002 6 0.815 0.818 0.005 15 0.809 0.810 0.003 7 0.817 0.817 0.004 16 0.807 0.809 0.003 8 0.810 0.814 0.007 17 0.807 0.808 0.002 9 0.811 0.813 0.007 18 0.800 0.805 0.007
A Chart Plotting All Individual Values • Control charts that plot each individual value are useful when explaining the concept of variation. • On an individual values chart, the individual values from the subgroup are represented by a small mark. The average of those values is represented by a circle. • Usually, the chart is reserved for training people on interpreting the values of R and s charts.
Median and Range Charts • When a median chart is used, the median of each subgroup is calculated and plotted • The centerline of the median chart is the average of the subgroup medians. • The control limits of the median chart is determined using the formula shown in the next slide. • The procedure of construction of the range chart is the same as before. • The median chart is easy to compute. However, some sensitivity is lost.
Median and Range Charts • Formula:
Run Charts • A run chart is a line graph that shows data points plotted in the order in which they occur. • They are used to show trends and shifts in a process over time, variation over time, or to identify decline or improvement in a process over time. • They can be used to examine both variables and attribute data. • Time is displayed on the x axis and the variable or attribute being investigated is recorded on the y axis. • There are no control limits in a run chart.
Run Charts A run chart is constructed in five steps: 1. Determine the time increments. 2. Scale the y axis to reflect the values that the measurements or attributes data will take. 3. Collect the data. 4. Record the data on the chart. 5. Interpret the chart.
A Chart for Variable Subgroup Size • Traditional variable control charts are constructed using a constant subgroup sample size. • If the subgroup size varies, it is necessary to recalculate the control limits for every subgroup size. Each subgroup with a different sample size will have its own control limits plotted on the chart. • If the subgroup size increases, the control limits will be closer to the centerline. The gap between two control limits will be narrower.
Precontrol Charts • Precontrol charts do not use the process data to calculate the control limits. The control limits are calculated using specifications. • Precontrol charts • are simple to set up and use. • can be used with either variable and attribute data. • useful during setup operations - can determine if the process setup is producing product within tolerances • can identify if the process center has shifted or the spread has increased
Precontrol Charts • Precontrol charts cannot be used to study process capability. • Precontrol charts may generate more false alarms or missed signals than the control charts
Precontrol Charts 1. Create the zones: Red zone: Outside specification limits. Yellow zone: Inside specification limits. One of the specification limits is closer than the center of the specification. Green zone: Inside specification limits. The center of the specification is closer than both the specification limits.
Precontrol Charts 2. Take measurements and apply the setup rules: • Point in green zone: continue until five successive pieces are in the green zone • Point in yellow zone: check another piece • Two points in a row in the same yellow zone: reset the process • Two points in a row in opposite yellow zone: stop, reduce variation, reset the process • Point in the red zone: stop, make correction and reset the process
Precontrol Charts 3. Apply the precontrol sampling plan: • Once five successive points fall in the green zone, discontinue 100% inspection and start sampling. • Randomly select two pieces at interval: • A point in the red zone: stop, adjust process to remove variation, reset • Two points in the opposite yellow zone: stop, adjust process to remove variation • Two points in the same yellow zone: adjust process to remove variation • Otherwise: Continue
Text Problem 7.16 (7.13): NB Manufacturing has ordered a new machine. During today’s runoff the following data were gathered concerning the runout for the diameter of the shaft machine by this piece of equipment. A precontrol chart was used to set up the machines. Recreate the precontrol chart from the following data. The tolerance associated with this part is a maximum runout value of 0.002 (upper specification). The optimal value is 0.000 (no runout), the lower specificatin limit. 0.0021 0.0013 0.0018 0.0007 0.0002 0.0030 0.0024 0.0006 0.0002 0.0006 0.0004 0.0003 0.0010 0.0015 0.0011
Short-Run Charts • Traditional variable control charts work with long, continuous production runs. • Several methods have been developed for shorter production runs: • inspect the first and last pieces: gives no information on the pieces in between • 100% inspection: expensive and time consuming • separate charts for each pert number: a large number of charts, insufficient number of observations to calculate the control limits
Short-Run Charts • Short-run charts include multiple part numbers on the same chart. • As the short-run charts display multiple part numbers, it is possible to visualize the variation in the process. • The data are coded so that all the data, regardless of the part number, are scaled to a common denominator. So, there is common set of control limits for all the parts numbers. • The nominal and charts use coded measurements based on nominal dimension. • Coded measurement = Actual measurement - nominal value
Short-Run Charts Use the following steps to create a nominal and chart: 1. Determine parts that will be monitored with the same chart. • parts made by the same operator, machine, methods, materials and measurement techniques 2. Determine the nominal specification for each part number. 3. Collect data - use the same subgroup sample size for all part numbers. 4. For each measurement, compute coded value = actual measurement - nominal value. Compute average measurement for each subgroup.
Short-Run Charts 5. Plot the average measurements from step 4 on the chart. 6. Continue to calculate, code, and plot measurements for the entire run of the same part number. 7. When another part number is to be run, repeat steps 1 to 6. 8. When 20 subgroups have been plotted from any combination of parts, calculate control limits.Use the formula on the next slide. 9. Draw the centerline and control limits on the chart. 10. Interpret the chart.
Text Problem 7.19 (7.16): A series of pinion gears for a van set recliner are fine-blanked on the same press. The nominal part diameters are small (50.8 mm), medium (60.2 mm), and large (70.0 mm). Create a short-run control chart for the data shown on the next slide:
60.1 70.0 50.8 60.2 70.1 50.9 60.4 70.1 50.8 60.2 70.2 51.0 60.3 70.0 51.0 60.2 69.9 50.9 60.1 69.8 50.9 60.2 70.0 50.7 60.1 69.9 51.0 60.4 50.9 60.2 50.9 60.2 50.8
Reading and Exercises • Chapter 7 • Reading pp. 316-48 (2nd ed.) • Exercises 2, 5, 6, 7, 14, 15 (2nd ed.) • Reading pp. 322-55 (3rd ed.) • Exercises 2, 7, 8, 9, 17, 18 (3rd ed.)