Download
1 / 23
240 likes | 505 Vues
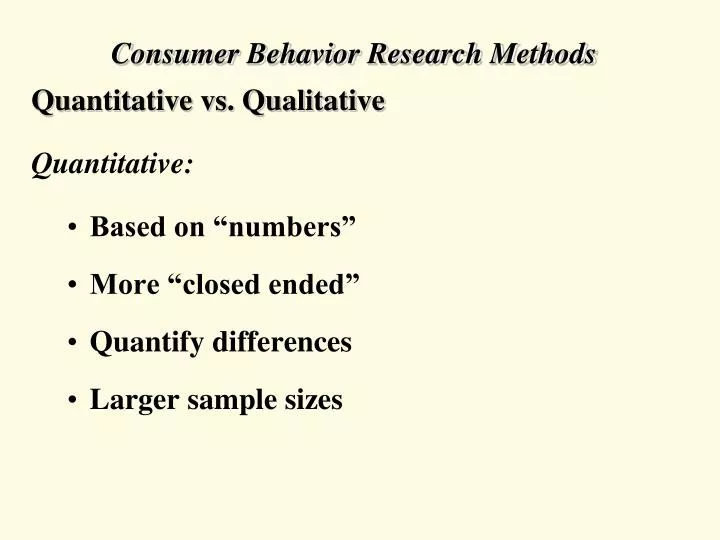
Consumer Behavior Research Methods Quantitative vs. Qualitative Quantitative: Based on “numbers” More “closed ended” Quantify differences Larger sample sizes. Qualitative: Based on “intuition and experience” More “open ended” Interpretation by researcher Smaller sample sizes.

E N D
Consumer Behavior Research Methods Quantitative vs. Qualitative Quantitative: • Based on “numbers” • More “closed ended” • Quantify differences • Larger sample sizes
Qualitative: • Based on “intuition and experience” • More “open ended” • Interpretation by researcher • Smaller sample sizes
Correlational vs. Experimental Correlational: • naturally occurring relationships • Difficulty with cause & effect
Advantages • Some things can’t be manipulated • More “natural” look at behavior • New phenomenon • Several variables • Disadvantages • Cause & Effect? • Confounds ?
Experimental: • cause & effect • manipulate variables • control extraneous variables
Independent Variable: • Variable doing the causing • “manipulated” variable Dependent Variable: • Variable being “effected” • “measured” variable
Random Assignment Group 2: Control Group 1: Treatment DV DV Between Groups Experiment:
DV IV DV Within Groups Experiment: Before & After / Simple Baseline Design
Research Tools Surveys: • ask people basic things • often just opinions • large sample • scales and open end • descriptive – use cross tabs • not very in depth • can get misrepresentation
Questionnaires / Tests: • more detailed • variety of methods to collect data • typically quantitative • convenient • validity and reliability issues • accuracy?
Focus Groups: • Small groups • In depth discussions • Trained moderator leads • Leads as the group dictates • Qualitative
BUT: • Social desirability • Misrepresentation • Memory • Leading questions • Misinterpretation by moderator • Interpretation biases • See what they want to see?
Interviews: • one-on-one, diads, triads • more open ended • similar in some respects to focus groups • can be long term • more intimate questions than focus groups • verbal and nonverbal important • qualitative • similar problems as with focus groups
Storytelling: • consumers tell stories • about product • about similar products • about hypothetical products/situations • features, use, experiences etc. • qualitative • insight from researcher • focus on tangible and intangible
Ethnographics: • extended time with consumer • similar to storytelling • but their life is the “story” • direct observation • relates consumer attitudes and actual usage • context!
Ethnographics: • Lifestyle • Actual product usage • Interviews: • bonding is crucial • subject leads • observe environment (photo/video) • observe non-verbal
Purchase Panels: • group consumption examined • individuals represent segments of pop. • typically tracked electronically • Neilson ratings • TOPPS Club • can see what sells • track if ads are working • see if patterns change after promotions
Correspondence Analysis: • Perceptual Maps • find out how many people say they think a factor is important for different brands • shows factors that “cluster” with a certain brand • graphical
eg. Tell which brands match each of the adjectives: Ford BMW Mitsubishi Toyota Honda Fun Prestige Reliable Good Resale Quality Speed Practical
* Quality * Reliable * Good resale * Prestige BMW Toyota Honda * Speed practical * Ford * Many colors * Fun Mitsubishi
Derived Importance: • “underlying” reasons • STATED IMPORTANCE • compared to DERIVED IMPORTANCE • rate preference of different brands • rate how much attribute fits each brand • features that drive consumption should be rated higher for more preferred brands • graphical representation • “quadrants” of opportunity
Minimum Requirements High Impact Requirements Stated Importance Hidden Opportunity Limited Opportunity Derived Importance
* Good resale * Quality * Low price SI * Speed * Many colors * Fun DI