Exploring Univariate Distributions: Patterns and Analysis Techniques
Dive into exploring univariate data distributions through graphical displays, summary measures, outliers, and comparing features like center, spread, and shape. Emphasizes interpretation of graphical and numerical data.

Exploring Univariate Distributions: Patterns and Analysis Techniques
E N D
Presentation Transcript
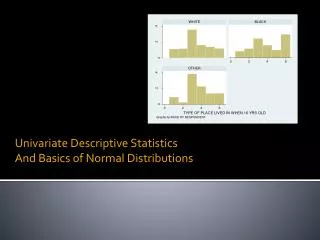
Univariate Distributions Overview
I. Exploring Data Describing patterns and departures from patterns (20%-30%) Exploring analysis of data makes use of graphical and numerical techniques to study patterns and departures from patterns. Emphasis should be placed on interpreting information from graphical and numerical displays and summaries.
I. Exploring Data • Constructing and interpreting graphical displays of distributions of univariate data (dotplot, stemplot, histogram, cumulative frequency plot) • Center and spread • Clusters and gaps • Outliers and other unusual features • Shape
Multiple Choice Questions • Read and think for one minute, and write your answer. • Discuss with group members for 30 seconds and decide on a final answer. • Discuss as a group for as long as we need to. . .
I. Exploring Data • Summarizing distributions of univariate data • Measuring center: median, mean • Measuring spread: range, interquartile range, standard deviation • Measuring position: quartiles, percentiles, standardized scores (z-scores) • Using boxplots • The effect of changing units on summary measures
Free Response Questions • We’ll do each one a little differently, so listen for directions. • They’ll all start with you reading and answering the question, but a bit faster than you would need to do on the actual exam.
I. Exploring Data • Comparing distributions of univariate data (dotplots, back-to-back stemplots, parallel boxplots) • Comparing center and spread: within group, between group variables • Comparing clusters and gaps • Comparing outliers and other unusual features • Comparing shapes