Univariate Data
This resource provides a comprehensive overview of univariate data analysis, covering chapters 1-6. It discusses various types of data, including categorical and quantitative, alongside graphical representations such as bar charts, pie charts, and histograms. The guide details important measures of center (mean, median, mode) and spread (range, IQR, standard deviation). It emphasizes the significance of the distribution's shape, skewness, and how these influence mean and median relationships. Use this guide to enhance your understanding of data distribution and visualization techniques.

Univariate Data
E N D
Presentation Transcript
Univariate Data Chapters 1-6
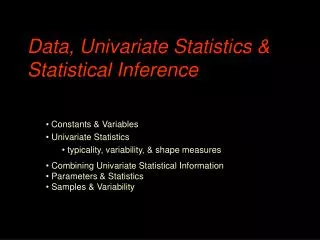
UNIVARIATE DATA • Categorical Data • Percentages • Frequency Distribution, Contingency Table, • Relative Frequency Bar Charts (Always for comparison, • Pie Charts, Segmented Bar Charts. • Quantitative Data • Dot Plots, Stem Plots, Box Plots, Histograms, • Cumulative Frequency Histogram
Another Graphical Display for Categorical Data is a Pie Chart
Contingency Tables and Segmented Bar Charts Relative Frequency Table Frequency Table
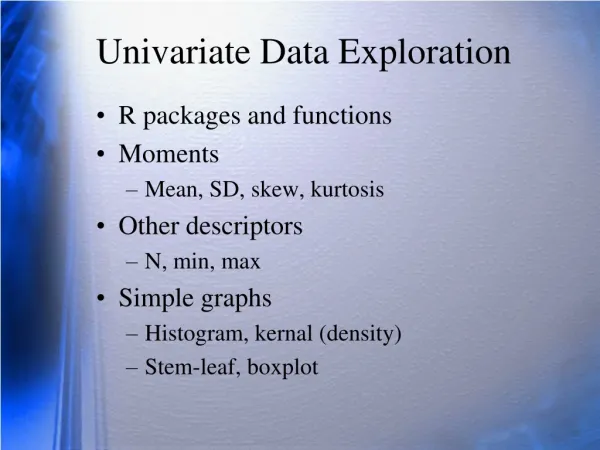
Quantitative Data Distribution: Center, Shape, Spread, Outliers Measures of Center: Mean, Median, Mode Measures of Spread: Range, IQR, Standard Deviation Mean goes with Standard Deviation, Median goes with IQR Use mean and standard deviation when distribution is unimodal and symmetric Outlier Rule = 1.5 x IQR Addition/Subtraction changes only measures of Center Multiplication/Division changes measures of Center and Spread
Describing Shapes of Distributions • Remember! • If distribution is unimodal and symmetric, the mean end median will be approximately • the same • If the distribution is skewed right, the mean will be to the right of the median • If the distribution is skewed left, the mean will be to the left of the median • Skewed distributions tend to have more variation than symmetric distributions