Download

1 / 11
110 likes | 341 Vues
Data Cleaning and spotting outliers with UNIVARIATE. Michael Auld PhUSE Brighton 2011. Why outliers are important. Skewed F-shape curve may reveal bias in the population May indicate power of trial isn ’ t strong enough – expensive fail. Mean. Asymmetric curve (F-shape).

E N D
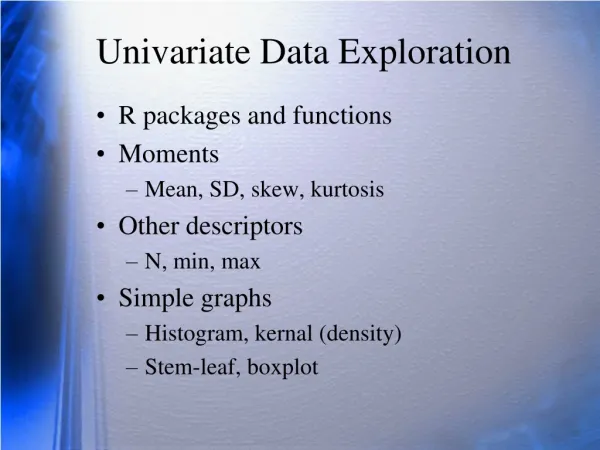
Data Cleaning and spotting outliers with UNIVARIATE Michael Auld PhUSE Brighton 2011
Why outliers are important • Skewed F-shape curve may reveal bias in the population • May indicate power of trial isn’t strong enough – expensive fail Mean Asymmetric curve (F-shape) Normal distribution (bell) • May be an indication of data quality errors • Good to spot early whatever the reason Outliers PhUSE 2011 Brighton
UNIVARIATE ODS tables Output Added: ------------- Name: Moments Label: Moments ------------- Output Added: ------------- Name: BasicMeasures Label: Basic Measures of Location and Variability ------------- Output Added: ------------- Name: TestsForLocation Label: Tests For Location ------------- Output Added: ------------- Name: Quantiles Label: Quantiles ------------- Output Added: ------------- Name: ExtremeObs Label: Extreme Observations ------------- Output Added: ------------- Name: MissingValues Label: Missing Values ------------- PhUSE 2011 Brighton
ODS SELECT ExtremeObs; PROC UNIVARIATE DATA=sds.lb NEXTROBS=10; CLASS lbtest; ID usubjid; VAR lbstresn; RUN; Extreme values The UNIVARIATE Procedure Variable: lbstresn LBTEST = ABS. NEUTRO.COUNT Extreme Observations --------------------Lowest------------------- ------------------Highest----------------- Value subjid Obs Value subjid Obs 0.00000 0074-0018 459425 2730 0067-0017 412339 0.00000 0053-0008 311137 2920 0067-0017 412471 0.00000 0053-0008 311125 2920 0067-0017 412472 0.00036 0100-0012 607593 3200 0067-0017 412498 0.00215 0033-0013 188278 3200 0067-0017 412499 0.01000 0048-0019 279017 3500 0067-0017 412525 0.01000 0048-0019 279016 3500 0067-0017 412526 0.01500 0084-0008 511085 3680 0067-0017 412432 0.01900 0064-0013 397497 3680 0067-0017 412433 0.02000 0048-0019 279007 5330 0059-0005 352791 The SAS System The UNIVARIATE Procedure Variable: lbstresn LBTEST = ALBUMIN Extreme Observations -------------------Lowest------------------ ------------------Highest------------------ Value subjid Obs Value subjid Obs 0.029 0027-0008 147516 70.5 0017-0019 91342 PhUSE 2011 Brighton
Quantiles analysis The SAS System The UNIVARIATE Procedure Variable: lbstresn LBTEST = ALBUMIN Quantiles (Definition 5) Quantile Estimate 100% Max 470.000 99% 61.700 95% 53.000 90% 49.000 75% Q3 46.000 50% Median 43.000 25% Q1 39.550 10% 36.300 5% 34.000 1% 26.000 0% Min 0.029 Note the extreme gap between 100th and 99th percentiles The SAS System The UNIVARIATE Procedure Variable: lbstresn LBTEST = ABS. NEUTRO.COUNT Quantiles (Definition 5) Quantile Estimate 100% Max 5330.000 99% 10.380 95% 6.424 90% 5.350 75% Q3 3.960 50% Median 2.910 25% Q1 2.120 10% 1.512 5% 1.110 1% 0.450 0% Min 0.000 Large gap also observed between 0th and 1st percentiles PhUSE 2011 Brighton
Method and Rationale Determine programmatically what made those observations stand-out from the crowd The answer is context – the distance between that 95th and the 100th percentile when compared with the others Why not project back from the 5th and forward from the 95th to determine the expected values at 0th and 100th (the min and max) PhUSE 2011 Brighton
The SAS code bit PROC UNIVARIATE DATA=sds.lb NOPRINT; CLASS lbcat lbtest; VAR lbstresn; OUTPUT OUT=mydata PCTLPTS=5 95 MIN=min MAX=max PCTLPRE=p; RUN; DATA nthdegree; SET mydata(WHERE=(NOT MISSING(max))); pn = (p95 – p5)/90; p0 = MAX(p5 – (5*pn), min); p100 = MIN(p95 + (5*pn), max); RUN; PhUSE 2011 Brighton
The SAS code bit PROC UNIVARIATE DATA=sds.lb NOPRINT; CLASS lbcat lbtest; VAR lbstresn; OUTPUT OUT=mydata PCTLPTS=5 95 MIN=min MAX=max PCTLPRE=p; RUN; DATA nthdegree; SET mydata(WHERE=(NOT MISSING(max))); pn = (p95 – p5)/90; p0 = MAX(p5 – (5*pn), min); p100 = MIN(p95 + (5*pn), max); RUN; PhUSE 2011 Brighton
Select the extreme obs and raise queries PROC SQL NOPRINT; CREATE TABLE lab_outliers as SELECT lb.* ,extreme.min ,extreme.p0 ,extreme.p5 ,extreme.p95 ,extreme.p100 ,extreme.max FROM nthdegree AS extreme LEFT JOIN sds.lb ON lb.lbcat EQ extreme.lbcat AND lb.lbtest EQ extreme.lbtest AND ((extreme.min <= lb.lbstresn < extreme.p0) OR (extreme.p100 < lb.lbstresn <= extreme.max)) ORDER BY usubjid, lbcat, lbtest, visitnum ; QUIT; PhUSE 2011 Brighton
Further reading... Contact... Cody’s Data Cleaning Techniques using SAS (Ron Cody, SAS Press Series 2008) BASE SAS Procedures Guide , SAS Publishing michael_auld@eisai.net PhUSE 2011 Brighton
Questions... PhUSE 2011 Brighton