Download
1 / 16
160 likes | 173 Vues
Discover the detailed process of creating scientific visualization and digital effects in movie production pipelines. Learn how a visionary communicates their vision to the production crew, from storyboard to final editing. Explore the key steps involved, such as collaborating with climate experts, obtaining necessary data, determining rendering techniques, and building digital scenes. This methodology aims to bridge the gap between scientific discoveries and engaging visual storytelling for better communication. Dive into the future possibilities of scientific visualization and storytelling in climate communication.

E N D
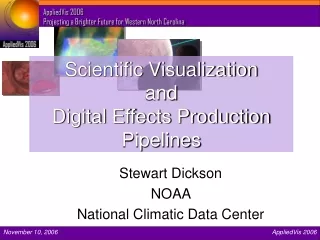
Scientific VisualizationandDigital Effects Production Pipelines Stewart Dickson NOAA National Climatic Data Center
How Does an Effects Movie Get Made? • A Visionary Communicates a Vision to a Production Crew
How Does a Movie Get Made? The Visionary The Vision • A VISIONARY Communicates a Vision to a Production Crew Production Crew
The VISIONARY The Vision Directorial Story S u p e r v i s i o n Art Script Concept Shot Breakdown Story Board Production Crew
Shot Breakdown -> The Storyboard Time 00:00:00 Sequence 1 Scene 1.1 00:00:15 . . . . . . Act I 00:28:34 Sequence 6 Scene 6.1 00:29:01 Scene 7.1 Sequence 7 00:29:05 Scene 7.2 Act II 00:33:29 . . . . . . 01:05:29 Sequence 12 Scene 12.1 01:10:59 Sequence 13 Scene 13.1 01:14:55 . . . . . . Act III 01:19:25 Sequence 18 Scene 18.1 01:25:09
Production Crew Characters The VISION Props Story Scene X.y Sets Art Script Environments Shot Breakdown Concept Lights Cameras Story Board EFX Editing
How Does a Scientific Movie Get Made? • A Scientist Makes an Important Discovery • Scientists are Really Bad at * Communicating a Vision • A Visionary Communicates the Vision to a Production Crew
Production Crew Environment The Discovery Data Source 1 Scene The VISION Data Source 2 Story Data Source 3 Art Script Lights Shot Breakdown Concept Cameras Story Board EFX Editing
Current Climate Visualization Production Pipeline • Collaborate with those who understand the climate trend • Identify the spatial and temporal ranges for the trend • Obtain necessary model or historical data for visualizing the trend • Determine appropriate rendering technique per data type • Build the digital scene, Develop the Story • Rendering and final editing
1. Collaborate with those who understand the climate trend • An intermediary translates between the scientists and the artists • Understanding is converted to narrative • The script produces narration, voiceover, audio track • The shot list and storyboard are delivered to the production crew
2. Identify the spatial and temporal ranges for the trend • Spatial (Longitude-Latitude) • Temporal (Date/Time) • Prediction model or historical database gives this information.
3. Obtain necessary model or historical data for visualizing the trend • GIS layers -- “Environment” -- Context • GOES BAND 1 IR Satellite • Fixed Weather Station • Moored Buoy • River Gage • NEXRAD Level-II • Model Data, Historical Weather Event Data
4. Determine appropriate rendering technique per data type • Vector Field, “Weather Vanes”, Streamlines • Iso-Surfaces, Volume Rendering • Color-Mapped Scalar-Valued Surfaces • Binary Image-Mapped Surfaces
5. Build the digital scene, Develop the Story • Plan the Shots [Storyboard] • Select camera position • Work on the Story-Telling • Iterate with the scientific and outreach groups • Develop the communication toward popular understanding of the science.
6. Rendering and final editing • Inter-cut elements from different visualization software sources • Two-Dimensional Compositing and Effects • Add titles, narration, additional explanatory elements
Future WorkScientific Visualization • Discovery-to-Vision -- Weak Link • Put the Story ahead of the Data • The Data serves the Story • Not the other way around Create the Story Development methodology for communicating about climate and the weather