Download

1 / 80
860 likes | 1.13k Vues
Very Large Power System Operators in the World. S.P.Kumar Chief Manager Power System Operation Corporation Ltd. Indian Power System : Amongst the Largest in the World. National Grid (UK) 68GW Capita: 65m. SO - UPS (Russia) 146 GW Capita: 144 m. PJM (USA) 165GW Capita: 51m.

E N D
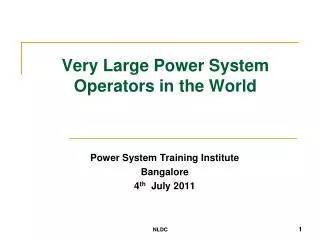
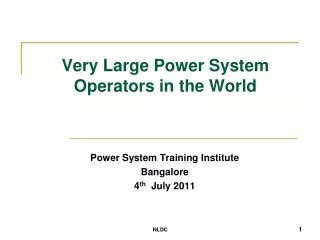
Very Large Power System Operators in the World S.P.Kumar Chief Manager Power System Operation Corporation Ltd. NLDC
Indian Power System : Amongst the Largest in the World National Grid (UK) 68GW Capita: 65m SO - UPS (Russia) 146 GW Capita: 144m PJM (USA) 165GW Capita: 51m MidWest ISO (USA) 159GW Capita: 40m SGCC (China) 900GW Capita: 1000m RTE (France) 93GW Capita: 65m Tepco (Japan) 64GW Capita: 45m Red Electrica (Spain) 93GW Capita: 47m KPX (South Korea) 70GW Capita: 49m ONS (Brazil) 100GW Capita: 170m PGCIL (India) 163GW Capita: 1200m Terna (Italy) 57GW Capita: 60m Eskom (South Africa) 43.5GW Capita: 49m Source: VLPGO, 2010
Snapshot Of Indian Power System
Demand :~ 110 GW Generating Units :~ 1600 400kV & above Trans. Line :~ 700 Transformers :~ 2000 Busses :~ 5000 Control Areas :~ 100 Inter-State Metering Points :~ 3000 Schedule Matrix Elements :~ 96 X 100 X (~10) ~=100000 Open Access transactions typical daily :~ 100 Captives participating in market :~ 125 Typical Numbers for Indian Power System…
Peculiarities of Indian Power System • High Growth Rate • Shortage – both (MW & MU) • Federal Structure • Decentralized Scheduling & Despatch • Diversity • Floating Frequency • Large Hydro Variation • Large Demand Variation
How do we relate Internationally to the Other Grid Operators Worldwide ? Associations Worldwide Very Large Power Grid Operators (VLPGO) TSO-Comparison Group (http://www.tso-comparison.com) CIGRE (INTERNATIONAL COUNCILON LARGE ELECTRIC SYSTEMS) - C2 and C5 committees http://www.cigre-c2.org/System Operation and Control http://www.cigre-c5.org/Electricity Markets and Regulation (Conseil International des Grands Réseaux Electriques). International Interconnections SAARC
Formation of the VLPGO • A voluntary initiative of the world’s largest Power Grid Operators • Representing together more than 60% of the electricity demand in the world. • 14 Largest power grid operators of the world • Created in 2004 • Not-for-profit organization • Followed several blackouts across the world • To investigate fundamental issues of common interest to its members • To develop joint action plans addressing the improvement of power system security. • Formalized in 2009 • Specific Focus • Issues related to Very Large Power Grids • Membership • Size > 50 GW
VLPGO : Role of Grid Operators Worldwide • Work constantly to plan, monitor, supervise and control the energy delivered as a continuous process 24 hours a day • Delivering the electricity that powers modern societies • Critical role of Grid Operators includes • acting on behalf of Consumers, to ensure quality while minimizing costs and recognizing economic and societal dependence on electricity; • a technical role in planning, designing, and managing the Power Systems; • an interface role with generators, market participants and distributors, which are the most direct users of the transmission grid; • a natural role of interlocutors with power exchanges, regulators and governments.
Common Challenges for VLPGO • Providing power system reliability and security • Smart Grid development • Integration of Renewables • Integration of Electric Vehicles • Capacity development and optimization including system renovation and development, equipment upgrading. • Reducing CO2 emissions • Improve productivity and energy efficiency • Power system visualization • Demand Side Management • Interconnections • Development of new technologies and HVDC • Establishment and coordination of new control centers 11
VLPGO Vision and Mission Vision “To be a leader and a catalyst in the transition of the electric power industry to the power grid of the 21st century” Mission Develop an international consensus on strategic issues which are unique to the very large power grid and market operators Develop a common vision with respect to the technologies and best practices required to address those issues Facilitate the implementation of the vision through information exchanges, collaborative projects and cooperation with other international organizations.
Objectives: Transition to Grid of 21st Century Innovate Thinking An international consensus on strategic issues challenging the very large power grid and market operators Technology Advancement A common vision with respect to the technologies and best practices required to address those issues in a framework of social and environmental responsibility of each member. Industry Leadership Through a common Communication Policy, the dissemination and implementation of a common vision through information exchange, collaborative projects and cooperation with other international organizations.
Expectation within VLPGO framework • Sharing worldwide experience and knowledge on best practices to improve the power system security and performance • Building a common vision on the transition towards a more modern power system (i.e. Smart Grids) • Being catalyst towards Manufacturers and Vendors to make available the best technologies to the Power Systems • Creating a industry voice on the transition to a more sustainable energy system and the journey to COP 17 and the enabling environments required to support the electricity supply industry worldwide. • Enhancement of transmission security: security must be a permanent concern of VLPGO • Communication Strategy: PGOs must have communication strategies for regular, risk and crisis situations. 14
VLPGO Delivering Value to its Members • Emerging Technology • Identify early trends • Assess common impacts • Develop common solution requirements • Shared Learning • Identify common key operational risks • Share after-the-fact analysis of major events • Common Approaches & Solutions • Develop common specifications across suppliers • Create new market mechanisms • Produce guidelines for common reliability issues • Best Practices • Share “best” Ideas and policies • Create methodologies for evaluation or analysis • Industry Influence • Develop common positions for industry stakeholders
Structure of VLPGO Activities The VLPGO consists of: Governing Board 2 Workshops 5 Working Groups 5 Joint Projects Short-term collaboration on specific project by subset of members One of exploration of topic area Task Task Task Task Task The Governing Board has: • Streamlined the working approach between different forums • Is writing guidance for conveyors – to improve performance (2010) • Focused on a smaller number of activities to deliver material progress & create a multi-year plan
VLPGO 2011 Joint Activities Working Groups WG #1 – Wide Area Monitoring Applications (PJM) WG #2 – Enhanced Security (Terna/ONS) WG 2a – Security vs. Operation Costs (Terna/ONS) WG 2b – Enhanced Network Restoration (Terna/ONS) WG 2c – Equipment Overstressing (ONS) WG 2d –Security of Supply to large metro areas (?) WG #3 – Integration of Renewables (NG) WG #4 – Load Forecasting (REE) WG #5 – HVDC (ONS) WG #6 – Electric Vehicles (PJM) WG #7 – Storage (MISO) Joint Projects Visualization (SGCC) Workshops WS #1 – KPIs (SO UPS) WS #2 – Smart Grid (KPX) 18
VLPGO Current Activities - mapped Principle Drivers Smart Renewable Security and Safety of Supply WG #3: Integration of Renewable Technologies WS #1: Smart Grids WG #2a: Enhanced Security - Vulnerability JP #3: Plug-in Hybrid Electric Vehicles JP #2: HVDC in Synchronous Power Systems JP #4: Monitoring and Automation Enduring Drivers New Technology WG #1: SynchroPhasors (Wide Area Monitoring) Efficient Operation #5: Visualization WG #2c: Equipment Overstresses JP #1: Asset Management WG #2b: Enhanced Security - Restoration WS #2 – Key Performance Indicators (KPIs)
VLPGO Accomplishments thus far SynchroPhasors: WAMS Architecture Requirements and PMU Certification Test Methodology Preliminary Report”, 2008 Capacity Markets: “Market Mechanisms and incentive Instrument to Promote Generating Capacity and Demand Response”, 2008 Self Healing Grid: “Cascading Events and How to Prevent Them – Restoration Process Prevention Of Large-Scale Blackouts In The Large Metropolitan Cities”, 2006 - Application Guide “Self Healing Techniques to Prevent Black Outs and Cascading Events”, 2008 EMS Architecture: EMS Architectures for the 21st Century (transferred this work to CIGRE working group D2.24) 20
VLPGO Future Drivers Principle Drivers Connecting low carbon renewable sources of generation Ensuring the future Security and Safety of Supply of our networks Building SMARTer electricity networks of the future & the impact of SMART load changes Enduring Drivers Advancing and implementing new technology to the benefits of our customers Developing network capacity & operating our electricity networks in the most efficient and economical way we can
TSO – Comparison GroupThe Group of International Comparison of Transmission System Operation Practice
Mission To exchange information on Power System Operators current and future operating practices for the purpose of benchmarking. An annual survey is undertaken to ascertain Equivalent staffing requirements Best practices Performance measures Areas Transmission system operations including generation scheduling and dispatching, Electricity market operation, Operations planning, Settlements, Information technology, training, etc. TSO is managed by a Steering Committee consisting of 6 elected members and supported by KEMA
Most important reasons for being a member • Performance Measures Database (> 50 data points) • Comparing with other TSOs (Benchmark Model) • Identification of peers (Company profiles / Activity Lists) • Learning from other TSOs (Best Practice) • Informal contacts and TSO Questionnaires (Networking) • Counter Benchmark to Regulatory Benchmark (Insurance policy)
Members Members Name Country ESKOM South Africa Red Eléctrica de España* Spain Landsnet Iceland Fingrid* Finland Amprion* Germany Transpower NZ* New Zealand Saudi Electricity Company Saudi Arabia TenneT Netherlands Statnett SF Norway PJM Interconnection** PA, USA National Grid Electricity Transmission* United Kingdom CLP Power* Hong Kong ESB NG Ireland Transpower Germany Swissgrid Switzerland Rede Eléctrica Nacional Portugal Hydro Québec Canada Svenska Kraftnät Sweden PSE Poland EWA Bahrain China Southern Power Grid China Power Grid Corporation of India Ltd. India
Benchmarking Model The TSO Comparison Group is using an advanced multidimensional Benchmark Model for comparing TSOs’ System Operation organization. The Model’s “multidimensional approach” provides insight into the efficiency and effectiveness of each TSO with respect to both its own environment (size, structure, regulation et al) and to other TSO environments. The Model’s output has demonstrated the capability of identifying generic differences (resulting in ad hoc peer-groups) as well as generic similarities. The Model’s output has been utilized for mergers (in defining staff sizing requirements), and tested for self-analysis (in validating actual staff sizes).
Features of the benchmarking model The model aids in highlighting the effects of non-traditional changes within peer groups. As non-traditional changes, such as new Market initiatives are developed, the Model will display the areas of change. Although the value of those changes will vary with corporate objectives, the magnitude and the areas impacted by the changes will be highlighted by the Model. The key feature of the Model is that it does not focus on defining the “best” and the “worst” TSOs, but rather focuses on identifying differences between TSOs. Whether differences are good or not will depend on many factors – the Model allows the user to make those value decisions based on the goals of the respective user.
For Benchmark purposes a ‘standard TSO’ with five key System Operation processes has been defined.. System Operation
..and a process which takes into account the remaining differences between TSOs
Data Collected annually since 2000,validated by KEMA, verified by group Example of data points: All data are availableformembers
For each process, two benchmark models have been developed… Environmental Factors(e.g. network size) TSO Process Input(staff, cost) Output(uniform) COST Based Model PERFORMANCE Based Model
..Here, an example of one of the 10 benchmark models is shown Environmental FactorsEF1: Network Size (circuit ends, generators, interconnectors) EF2: PlannedOutages (Transmission and Generation) Operations Planning InputFTE Output(uniform) Model parameters basedonregression of TSO data
Real Time Operation FTE Model • At the Interim workshop it was decided to apply a fix constant of 6 for the RTO (FTE) model, which is considered to be to be the minimum staff required for 24 x7 operation in a control centre. EF1= NTW3 + NTW3a + 5*(NTW4 + NTW10a + NTW10b) EF2= RTO5 FTE = ß1 EF1 + ß2 EF2 + 6 ± error NTW3 = Circuit Ends NTW10a = AC Interconnectors NTW3a = Switched circuit ends NTW10b = DC Interconnectors NTW4 = Generation Units RTO5 = RTO Transmission outages taken
Operation Planning FTE Model EF1= NTW3 + 5*(NTW4 + NTW10a + NTW10b) EF2= OPL1 + OPL2 + SCH3 NTW3 = Circuit Ends OPL1 = Planned Transmission outage requests NTW4 = Generation Units OPL2 = Planned Generation unit outages NTW10a = AC Interconnectors SCH3 = Foreseen Transmission concerns NTW10b = DC Interconnectors
Scheduling FTE Model EF1= SCH3 + SCH5 + SCH6 SCH3 = Foreseen Transmission concerns SCH5 = Scheduled Transmission outages SCH6 = Scheduled Generation outages
Cost or FTE After the Fact FTE Model EF1= NTW3 + 5*(NTW4 + NTW10a + NTW10b) EF2= OAP4 NTW3 = Circuit Ends OAP4 = Unsupplied energy incidents NTW4 = Generation Units NTW10a = AC Interconnectors NTW10b = DC Interconnectors
Support FTE Model EF1= NTW3 + 5*(NTW4 + NTW10a + NTW10b) EF2= SCH5 + SCH6 NTW3 = Circuit Ends SCH5 = Scheduled Transmission outages NTW4 = Generation Units SCH6 = Scheduled Generation outages NTW10a = AC Interconnectors NTW10b = DC Interconnectors
Which results in an assessmentfor each process for FTE and Cost Example of BenchmarkResults Details are available to members only
Simultaneously differences between TSOs are being investigated… Part of ‘Activity List forOperations Planning process’ Share in IT costs Details are availableformembers
And summarized in management presentations Sum of fivebenchmarkresults Quality of System Operation(frequency, energynotsupplied, Voltage)
Results of Annual Survey An important basis for performance comparison and for improvement of operating practices. Experience of Members of the Group discussed each year in one or two Workshops upon invitation of one of the participating companies Membership of TSO is presently restricted to up to 30 companies / departments that qualify as an operator of a bulk transmission system
Guiding Attributes • Spirit of regional cooperation • Approach towards long-term planning • Energy policy structure and goals • Adherence to international agreements • Encourage cross border trades
International Interconnections - Benefits • Improving Reliability and Pooling of Reserves • Reduced investment in generating capacity • Improving load factor and increasing load diversity • Economies of scale • Diversity of generation mix and supply security • Economic exchange • Environmentally benign dispatch and siting of new plant • Coordination of maintenance schedules
International Interconnections – Various Aspects • Technical • Commercial • Regulatory/Legal • Coordination
Technical Objectives • Economy • Security • Reliability • Efficiency • Minimal environmental impact • Quality
Coordination • Working level coordination committee • Technical • Operation • Commercial • Protection
Weblink: http://www.un.org/esa/sustdev/publications/energy/interconnections.pdf
International Interconnections Nepal Bhutan Over 16 links of 132/33/11 KV Radial links with Nepal Net import by Nepal Tala: 1020 MW Chukha: 336 MW Kurichu: 60 MW Net import by India India- Bhutan synchronous links 400 kV Tala-Binaguri D/C 400 kV Tala-Malbase-Binaguri 220 kV Chukha-Birpara D/C 220 kV Chukha-Malbase-Birpara 132 kV Kurichu-Bongaigaon • Bangladesh • 400 KV AC line between Baharampur(India) and Bheramara(Bangladesh) with 500 MW HVDC sub-station at Bheramara Sri – LankaMadurai(India) and Anuradhapura(Sri-Lanka) through ±500 KV HVDC under sea cable Maps not to scale