Enhancing the Very Large Array: Advancements in Radio Astronomy and Cosmology
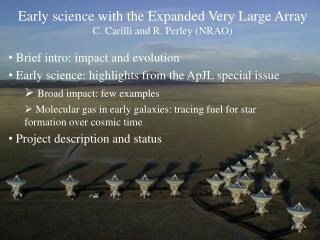
The expansion of the Very Large Array (VLA) offers unparalleled radio capabilities, enhancing our understanding of cosmic phenomena. With unique features like low obscuration, high-resolution imaging, and the ability to study transient sources, the expanded VLA can delve into the intricacies of galactic evolution, magnetic fields, and supermassive black hole accretion. Key improvements include dynamic scheduling, high-frequency coverage, and advanced spectral capabilities, making it a top-tier, flexible tool for astronomers. This upgrade is pivotal for exploring the universe's mysteries.

Enhancing the Very Large Array: Advancements in Radio Astronomy and Cosmology
E N D
Presentation Transcript
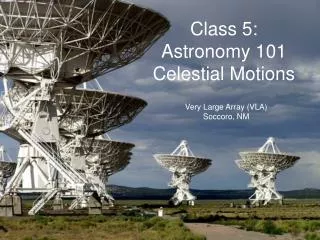
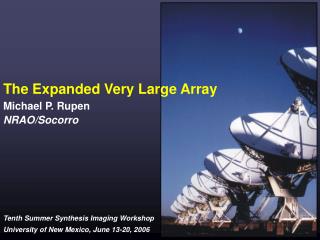
The Expanded Very Large Array Michael P. Rupen NRAO/Socorro
Why Expand the VLA?Unique Radio Capabilities Magnetic Fields Low Obscuration • No dust • no bias • see inner cores, where the action is • Polarization • Faraday rotation • Zeeman splitting Sgr A* The Evolving Universe Transient Sources • Acrretion • outflow • Trace both • thermal and • non-thermal • (AGN, Hii, • etc.) • Key lines • Trace shocks • and ejecta • Observe 24/7, • regardless of • weather, Sun, • etc. • High resolution CO at z=6.4
Why Expand the VLA?The Art of the Possible • The VLA is still the most flexible and sensitive radio telescope in the world. But... • it’s over 30 years old: the first VLA antenna came on-line on 24 October 1975 • major improvements are possible, at very little cost: keep the infrastructure (antennas, railroad track, buildings, …), but replace the electronics
The EVLA: Order-of-Magnitude Improvements • EVLA cost is less than ¼ the VLA capital investment • No increase in basic operations budget
Point-Source Sensitivity Improvements :1-s, 12-hours Red: Current VLA, Black: EVLA Goals
Frequency - Resolution Coverage • Continuous frequency coverage from 1 to 50 GHz match instrument to science, not science to instrument! • Blue area shows current VLA frequency -resolution coverage. • Green area shows future EVLA coverage. • Yellow letters and bars show band names and boundaries. • Two low frequency bands (74 and 327 MHz) omitted
Bandwidth and Spectral Capabilities • Combination of 2:1 bandwidth ratios and huge number of spectral channels • instantaneous spectral indices, rotation measures, uv-coverage • instantaneous velocity coverage (53,300 km/s vs. current 666 km/sec at 45 GHz) • lines at arbitrary redshift • Ridiculously flexible correlator 128 independently tunable sub-bands, vs. 2 now • “zoom in” on the regions of interest, and leave one 2 GHz baseband for continuum
The Time Domain • Dynamic scheduling • use weather efficiently • respond to transients • Fast time recording: initially 100 msec; 2.6 msec possible • Pulsars: 1000 phase bins of 200 μsec width, 15 μsec possible pulsar searches, timing, etc. with an interferometer!
Molecular Studies of High-RedshiftStar-Forming Galaxies • Currently: • 50 MHz (z range of 0.001 at 50 GHz!) • 8 spectral channels • No z searches • Very poor spectral resolution • Resolve out wide lines, and add noise to narrow ones • Each line must be done independently (CO, HCN, HCO+, …) Carilli, Walter, & Lo COJ=3-2 Z = 6.42 Peak ~ 0.6 mJy
Molecular Studies of High-Redshift Star-Forming Galaxies • EVLA: • 8 GHz (z=1.4 to 1.9 for CO J=1-0; z=3.8 to 4.8 for 2-1) • 16384 spectral channels (1 MHz res’n= 5.0 km/s) • 200 km/s galaxy is 40 channels • Every line at once • Interferometry: • spatial res’n • excellent spectral baselines
Quasar Absorption Line Surveys • Unbiased line surveys: • no dust obscuration • lots of random background sources • HI, CO, HCN, HCO+, … • evolution of cosmic neutral baryons from z=0 to 3 • large-scale structure • estimates of CMB temperature Absorption lines at z=0.88582 towards PKS 1830-211 (C. Carilli)
Star-Forming Galaxies at High Redshift • Sensitive to: • Synchrotron emission: AGN, SNR • Free-free emission: Hii regions • Thermal dust emission • Resolution 50 mas: 200 pc @ z=10 • Imaging: 1 arcsec over 30 arcmin @ 1.5 GHz • EVLA+ALMA give complete galaxy SED’s • 3 orders of magnitude of frequency • large range of redshift Spitzer dust non-thermal/AGN ionized gas Arp220 SED scaled to high redshifts.
Galaxies Closer to Home In one observation of a galaxy: • deepest radio continuum image yet made, with spectral index too • image all (UC) HIIs & SNRs • map HI emission & radio recombination lines • measure magnetic field orientation, Faraday rotation, and Faraday depth • absorption measurements against 100s of background sources • also rotation measures! • simultaneous “blind” HI survey 3x8 hours on a typical spiral galaxy
Strong Gravity and Black Hole Accretion:The Galactic Center Radio Infrared Sgr A* 10 arcsec ~ 1 l.y. VLT / NACO 1.6-3.5 microns VLA: 1 cm (Zhao)
EVLA: the radio view 100s of pulsars with Porbit<100 yr higher frequency to avoid dispersion due to ionized gas image fidelity (SgrA*:pulsar = 1e6:1) 10’s mas astrometry millisecond pulsar timing complete survey & monitoring of OH/IR stellar masers detailed rotation curve 3D motions of ionized gas free-free emission + radio recombination lines magnetic field structures and strength Mass and spin of a supermassive black hole deviations from elliptical orbits Extended dark matter distribution Tests of GR in ultra-strong regime Detailed accretion estimates Gas vs. stellar motions Strong Gravity and Black Hole Accretion:The Galactic Center
Magnetic Fields in Galaxy Clusters with X-rays,map magnetic fields & electron density in detail across entire, individual clusters Rotation measures towards Hydra A (G. Taylor) Residual RM towards 22 Abell clusters (T. Clarke) • >100 sources per beam (vs. current 1-2) for scattering & polarization studies • >20 RRMs per cluster for >80 clusters!
Galactic Black Holes:The Accretion/Outflow Connection • Ubiquity of jets • Monitoring • continuous multi-freq. coverage • work at 45 GHz 50mas res’n • triggering VLBI • Polarization • Going deeper • faint source imaging • typical rather than 20σ sources • other disk states • other source types (e.g., ULXs, low-luminosity XRBs, NS, etc.)
Stars • first detections of ordinary stars like the Sun • track radio emission from young stars (106 to 107 years) • flares in pre-main-sequence stars Stars detected with the VLA (S. White)
Magnetic Fields in the ISM • Zeeman splitting of H recombination lines directly measures ISM magnetic fields • Splitting is weak – 2.8 Hz per mG stack multple lines • 2-4 GHz band: 31 recombination lines • Each typically 250 kHz wide ~0.4% of the total band. • Need 10 kHz resolution • So, either 400,000 channels…or zoom in with WIDAR!
WIDAR Setup • Each line individually targeted • H, He, C lines all within 4 MHz sub-band • Res’n 15.6 kHz (1.6 km/sec) • Each of 62 spectra gets 256 channels • Or: use 8 MHz sub-bands with 4192 channels 0.2 km/sec resolution
Magnetic Fields in the ISM • EVLA resolution provides images of: • gas density, • temperature, • metallicity, • B-fields (Zeeman) • Sensitivity (12 hr, 5): • Sline ~ 0.1 mJy (stacked, integral) • B ~150 Gauss. • Orion, W3, Gal. Center …
Hundreds of Spectral Lines at once! • 414 lines (8 to 50 GHz) • 38 species • EVLA offers • Spatial resolution • Spectral baseline stability • Full polarization (Zeeman splitting!) • EVLA can observe 8 GHz at once – an average of 80 lines --- at 10 km/s velocity res’n (30 GHz) • EVLA can “target” many (~60) lines at once 8 GHz TA* TMC-1 (Nobeyama: Kaifu et al. 2004)
EVLA : Cost and Timescale • Proposal (EVLA-I) submitted to NSF in 2000 • Funding started in 2001 following NSB approval. • Completion by 2012 • A cooperative project: • $57M from NSF, over eleven years • $15M from Canada, (correlator, designed and built by HIA/DRAO) • $2M from Mexico, and • $8M from re-directed NRAO operational budget • A second proposal (EVLA-II) was submitted in April 2004 • Goal: to improve the spatial resolution by a factor 10 • $115M, over 7 years • The NSF recently (Dec 2005) declined to fund this proposal
EVLA Project Status • Six antennas currently withdrawn from VLA service, and being outfitted with new electronics. • Two fully outfitted & available upon request • Two being outfitted with final electronics, and are being intensively tested. Available for astronomical use by late summer. • Two others in early stages of outfitting. • Antennas will be cycled through the conversion process at a rate six per year, beginning in 2007. • Except for special testing, no more than three antennas will be out of service at any one time during construction phase.
Major Future Milestones • Test prototype correlator mid 2007 • Four antenna test and verification system • Not available for science • Correlator installation and testing begins mid 2008 • Capabilities will rapidly increase until mid 2009. • Correlator Commissioning begins mid 2009 • VLA’s correlator turned off at this time • New correlator capabilities will be much greater at this time. • Last antenna retrofitted 2010 • Last receiver installed 2012
New Capabilities Timescale • The old correlator will be employed until the new correlator achieves full 27-antenna capability – mid 2009. • Full band tuningavailable starting next year • Note also much-improved spectral stability • Limited dynamic scheduling has begun
Challenges: Data Processing • Data rates • peak from correaltor backend: ~25 MB/s • 8-hour “peak” observation ~ 700 GB (average is factor 10 lower) • data for 1 year ~ 80 TB • Analysis • data flagging • sources everywhere • full (wide!) bandwidth synthesis (must account for spectral index, pol’n, rotation measure, etc.) • high-fidelity imaging (10 mJy 104:1)
Challenges: Ease of Use • Much more complex and capable system • correlator modes • “wide-open” bands • lots of data • How do we make this power available to multi-wavelength users? • data volumes • “end-to-end” processing • imaging pipelines • readily accessible archive, NVO
EVLA Spin-offs • Correlator for eMERLIN • Renewed (international!) radio collaborations • common problems of data volume, deep imaging, etc. • Centimeter/millimeter connection • similar timescales for EVLA & ALMA • similar techniques • comparable instruments, and complementary information on much shared science • Opportunities as the VLA winds down • spectral line: e.g., deep HI images or surveys • time-dependent science: space telescopes, transient science, etc. • Note Oct06 call for Large Proposals!
Challenges: Strengthening the US Community • NSF funds radio astronomy through grants • budget is very tight compared to NASA • no direct tie to telescopes • unhealthy perception of competition between instruments (esp. NRAO) and science • Fabulous new instruments --- now we have to make sure they are used as fully as they can be! • international collaboration • obviously wonderful science • make it easier to use • more direct ties to space instrumentation (cf. Chandra) • innovative approaches within NRAO
NRAO and You • Staff support/collaboration • These schools • Travel support for US observers (NRAO and foreign telescopes) • Page charges • Paid sabbatical/summer visits • Postdocs • Traveling & resident Jansky fellows • Student support • GBT projects • grad students (2 mos.-2 years, full support) • undergraduates (Co-Op Program up to 1 semester/year; summer REU) • Aggressively pursuing other innovative programs • At last, we will be hiring!
A New Era for Radio Astronomy • After a long dry spell, telescopes galore • GMRT, SMA, eVLBI • EVLA, ALMA, ATA, eMERLIN, LWA, LOFAR, Australian initiatives, LMT, … • Looming on the horizon: the Square Kilometer Array • This is the perfect time to be a graduate student! • get in on the ground floor • influence “first science”, software design, how the arrays operate • a unique opportunity to mix technology, software, and science