Download
1 / 14
140 likes | 296 Vues
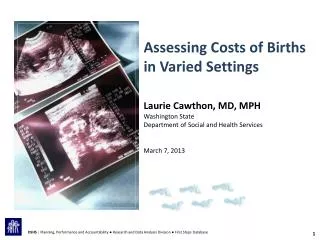
Assessing Costs of Births in Varied Settings. Laurie Cawthon, MD, MPH Washington State Department of Social and Health Services March 7, 2013. DSHS | Planning, Performance and Accountability ● Research and Data Analysis Division ● First Steps Database. Births in Washington State.

E N D
Assessing Costs of Births in Varied Settings Laurie Cawthon, MD, MPH Washington State Department of Social and Health Services March 7, 2013 DSHS| Planning, Performance and Accountability ● Research and Data Analysis Division● First Steps Database
Births in Washington State How many? 86,956 in 2011 Where? 3.1% at home or in free-standing birth centers From 2004 to 2011: number of home births increased nearly two-fold; proportion increased from 1.1% to 1.9% of total births From 2000 to 2011: number of births in birth centers also increased nearly two-fold; proportion increased from 0.7% to 1.2% Medicaid covers 50% of total Washington births. Washington is one of approximately 11 states with Medicaid reimbursement for direct-entry midwives
Required Data Elements • Medicaid claims (fee for service) and vital records are linked at the individual level for Medicaid mothers and their infants. • Vital Records also provide: maternal risk factors, birth weight, method of delivery, fetal and infant deaths. • Birth Attendants’ licensure/specialty was verified and typical delivery location determined.
Licensure and Typical Delivery Location For WA Providers of Out of Hospital Births
All WA Births N = 247,113 Non-Medicaid N = 119,000 Prenatal Care Providers and Achieved Birth Place for Washington State Women Who Gave Birth 2010-2012 Medicaid N = 128,113 Perinatologists N = 3544 All Other Medicaid N = 105,785 Home Birth Providers N = 598 Mixed BC and Home N = 911 CNMs at Hospitals N = 16,653 Birth Center Providers N = 642 Birth Center Delivery N = 340 Home Birth Delivery N = 410 Out of Hospital Delivery N = 611 Hospital Delivery N = 16,513
Average Medicaid Expenditures: Low Risk Births By Achieved Birth Place Type $6,858 + 22% Prenatal 44% $5,603 Comparison (Hospital Vaginal) = $5,603 45% 38% 42% Prenatal 52% $3,476 $3,259 Delivery 46% $3,085 Prenatal 44% Prenatal 52% Prenatal 60% Delivery 37% Delivery 41% Delivery 36% Delivery 31% Postpartum Care 10% Postpartum Care 11% 14% 12% 9%
Average Medicaid Expenditures: By Achieved Birth Place Type $7,046 + 22% Prenatal 49% $5,767 Comparison (Hospital Vaginal) = $5,767 39% 40% 39% Prenatal 53% $3,502 $3,533 $3,457 Delivery 40% Prenatal 52% Prenatal 50% Prenatal 48% Delivery 36% Delivery 40% Delivery 38% Delivery 39% Postpartum Care 11% Postpartum Care 11% 12% 11% 10%
Average Medicaid Expenditures: Low Risk Births Intent-to-Treat $5,792 + 7% $5,412 Comparison (Hospital CNM) = $5,412 Prenatal 50% 28% 33% 32% 31% Prenatal 54% $3,873 $3,748 $3,641 $3,691 Prenatal 58% Prenatal 52% Prenatal 48% Prenatal 49% Delivery 39% Delivery 35% Delivery 39% Delivery 37% Delivery 39% Delivery 33% Postpartum Care 11% Postpartum Care 11% 11% 12% 13% 9%
Average Medicaid Expenditures: Intent-To-Treat $6,039 $5,837 Comparison (Hospital CNM) = $5,837 + 3% Prenatal 51% 33% 20% 19% Prenatal 54% $5,014 $4,560 $4,475 Prenatal 51% $3,874 Prenatal 53% Prenatal 56% Prenatal 51% Delivery 38% Delivery 34% Delivery 40% Delivery 38% Delivery 34% Delivery 39% Postpartum Care 12% Postpartum Care 11% 9% 10% 10% 10%
CesareanDelivery Rate (%): Intent-To-Treat N = 94,898 N = 596 N =638 N = 907 N = 2,141 N = 16,585 N = 78,313 * All Hospital = No Prenatal Care by Midwife + Certified Nurse Midwife **All Out of Hospital = Home + Birth Center + Home and Birth Center (Mixed)
Assessing Costs of Births in Varied Settings Future Directions? • Extend analysis to other states with linked Medicaid claims and vital records and Medicaid reimbursement for out of hospital births • Increase Ns • Study different states’ models of care/reimbursement • Describe insurance issues for mother-infant dyad • Use medical record review or detailed analysis of claims data to identify timing of transfer of care, emergency transport expenses • Explore outliers and remove as appropriate • Include birth outcomes and infant medical care expenditures together with maternal expenditures • Compare transfer and C-section rates for nulliparous and multiparous women
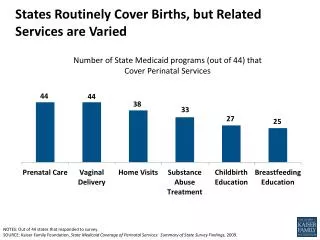
Current Medicaid-Birth Certificate Linkage and Medicaid Reimbursement for Licensed (Direct-Entry) Midwives Links Birth Certificates to Mothers /Infants Link Not Ongoing, Uncertain, or Other Purposes Does Not Link Linkage Status Unknown Medicaid Reimbursement for Licensed Midwives Data Sources: CMMI State questionnaire (1/28/2013) and Medicaid Medical Directors Learning Network state survey (2012) http://mana.org/statechart.html
CONTACT INFORMATION: Laurie Cawthon, MD, MPH Washington State Dept of Social and Health Services Research and Data Analysis cawthml@dshs.wa.gov