Download
1 / 48
480 likes | 639 Vues
This paper investigates the implications of high-frequency quoting on short-term volatility in bid/ask quotes, using AEPI as a case study. By analyzing market data from April 29, 2011, we highlight the National Best Bid and Offer (NBBO) and discuss how short-term quote volatility affects execution price risk, market performance monitoring, and transaction costs. We delve into concepts such as timing uncertainty, wavelet transforms for time-series analysis, and the economic significance of execution risks, offering insights into the complexities of modern trading environments.

E N D
High frequency quoting: short-term volatility in bid/ask quotes Joel Hasbrouck Now available at http://pages.stern.nyu/~jhasbrou
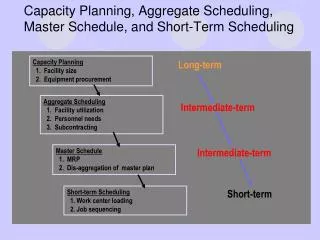
Illustration • AEPI is a small Nasdaq-listed manufacturing firm. • Market activity on April 29, 2011 • National Best Bid and Offer (NBBO) • The highest bid and lowest offer (over all market centers)
National Best Bid and Offer for AEPI during regular trading hours
Discussion points • The features of the AEPI episode. • Implications of short-term quote volatility. • Price risk and order timing uncertainty. • Time scale variance decompositions • Analysis of millisecond-stamped TAQ data • Dealing with truncated time stamps • Analysis of historical second-stamped TAQ data • Connections to existing studies • Outstanding questions • More pictures from the HFQ gallery
Short-term quote volatility … • Degrades the informational value of the quotes. • Induces execution price risk for marketable orders. • And dark trades that use the bid and ask as reference prices. • Impedes monitoring of market performance. • A dealer guarantees that he will sell to me at the market’s prevailing ask price. • Prevailing as of when? • Short-term quote volatility increases the value of the dealer’s look-back option. (Stoll and Schenzler)
Execution price risk for marketable orders • A buyer submits a marketable order at time . • The limit price is “infinite”. • Executed on arrival at the lowest offer. • Arrival is subject to a delay that is uniform random on • The execution price is random. • The outcome is characterized by mean and variance (risk) of price over
Connection to transaction cost analysis • Implementation shortfall imputation of trading cost is the difference between actual execution price and a benchmark price. • When there is timing uncertainty, a common benchmark is the value- or time-weighted price over a series of trades or an interval. • Usually the interval is an hour or a day.
Other sources of timing uncertainty • Information transmission lags • There are about • 17 “lit” market centers • publish visible quotes • 20 dark pools • don’t publish quotes, do report trades • 200 executing brokers • don’t publish quotes, do report trades
Time-scale decompositions • A time series = sum of components • Each component is associated with a particular time scale (“horizon”) • Each component is associated with a variance. • Horizons and components are constructed systematically using wavelet transforms
Sources • Percival, Donald B., and Andrew T. Walden, 2000. Wavelet methods for time series analysis (Cambridge University Press, Cambridge). • Gençay, Ramazan, Frank Selçuk, and Brandon Whitcher, 2002. An introduction to wavelets and other filtering methods in finance and economics (Academic Press (Elsevier), San Diego).
A microstructure wavelet perspective • Ask prices over 8 “millisecond” intervals • A trader with arrival uncertainty over this interval buys (on average) at • Deviations:
The wavelet smooth is • The wavelet rough is • “3” refers to time-scale (log base two): • “ is constant over ms”
A faster trader has arrival uncertainty of 4 ms. • He will trade within one of two 4 ms. windows: • His average price is either • , or • From his perspective where • Interpretation of “2”: “ is constant over ms.”
The fastest trader: arrival uncertainty of 2 ms. • He will trade within one of four two-ms. windows: • From his perspective • Where • “ is constant over ms.”
etails • Detail varies only at scale j. • Rough varies at scale j and finer scales.
Decomposition into • A detail varies over time scale • Details are orthogonal:
Variance decompositions • The price risk of the fastest trader (2 ms) • The price risk of the faster trader (4 ms) • The price risk of the fast trader (8 ms)
Formally, this is the Haar discrete wavelet transform. • One of a family of weighting/differencing schemes • Construct successive averages and differences in averages over intervals of length 1, 2, 4, 8, 16, … • Does N have to be an integer power of 2? • No. Received wisdom favors maximal overlap transforms (which don’t have this limitation).
Sampling properties • We can obtain asymptotic distributional results for difference-stationary processes. • A fifteen minute sample at ms.frequency has 900,000 observations. • But with discreteness and infrequent price changes, asymptotic validity is questionable. • I construct my estimates over 15-minute samples, and in panels.
An aside: should we work with price differences or levels? • Differencing at the resolution of the data obscures longer-term features. • “Differencing is a high-pass filter.”
Economic significance I • How large is the risk relative to other trading costs? • If we’re analyzing price levels, the units of are $ (per share) • Rescale to mils (one mil = $0.001) • Access fees in US equity exchanges are capped at three mils. • What is compared to three mils?
Economic significance II • How large is the risk relative to share value? • Some costs are measured as price relatives. • “The relative bid-ask spread is 0.1%, which is 10 basis points.” • measures relative volatility
Economic significance III • How large is the risk relative to what we’d expect from a random-walk? • For , get • The variance ratio between j and k is • Where j corresponds to a short interval (subsecond) and k to a longer interval (30 minutes)
Sample for cross-sectional analysis • For all CRSP firms present January through March of 2011, compute average daily dollar volume. • Sort into decile groups. • Take first ten firms in each group. • Reported results collapsed into quintiles.
Bid and ask • Source: TAQ with millisecond time-stamps, • All trading days in April 2011 • Construct series for National best bid and offer at one millisecond resolution. • Wavelet variances calculated over 15-minute intervals, 9:45-15:45
Table 2 Panel B excerptbasis points (0.01%) • Short-run volatility seems flatter across firms when it’s measured in mils per share
The cross-sectional results: a summary • In mils per share or basis points, short term volatility is on average small. • Variance ratios: short term volatility is much higher than we’d expect when calibrated to a random-walk. • Bid-ask correlations are often weak at sub-second time-scales. • These findings are particularly true for low-activity firms.
High-resolution analysis … … with low resolution data • TAQ with millisecond time stamps only available from 2006 onwards • TAQ with second time stamps available back to 1993. • Can we draw inferences about subsecond variation from second-stamped data?
Truncated time stamps • Assume that in a given second • We have N quote records • They are correctly sequenced. • The one-second time-stamps are generated by truncation of the millisecond remainder. • The arrival rate over the second is constant-intensity Poisson. • Then relative to the start of the second, the arrival time of the kth quote is distributed as the kth order statistic in a sample of variates.
A Bayesian imputation approach • Additional assumption • The arrival times are independent of the bid and ask realizations. • Simulate the millisecond arrival times and perform analysis on simulated data. • Check: try it on millisecond-stamped data, and see how results for simulated data match up with original data.
Correlations between wavelet variances computed • Using the orginalms. time stamps, and • Using simulation ms.time stamps
Why is agreement so good? • Time averaging implicit and explicit. • When the quotes are sparse (within the second), high-frequency variances are not highly sensitive to placement. • When the quotes are dense (within the second), the distribution of their arrival times is tight. • Agreement is weaker for correlations.
The historical sample • Construct dollar trading volume for all CRSP firms in the first quarter of each year 2001-2011 • In each year, take three firms from each dollar voldecile (30/firms per year) • 2001: only firms that traded in $0.01 • Analyze April Monthly TAQ data, 9:45-15:45
Given the increased quote traffic, why didn’t short-term quote volatility explode? • The good old days weren’t really that good. • “Gapping the quote” • Maybe the bad new days aren’t so nasty. • … At least between 9:45 and 15:45
The elements of the story • There is a presumption that HF activity has increased over the 2000’s • Strong trend in quote traffic • Short-term volatility (mils per share) does not show a clear increase. • Variance ratios show increase relative to 2001 (but not uniformly)
Connection to high frequency trading • Brogaard(2012), Hendershott and Riordan (2012) use Nasdaq HFT dataset: trades used to define a set of high frequency traders. • Hendershott, Jones and Menkveld (2011): NYSE message traffic • Hasbrouck and Saar (2012): strategic runs / order chains • General consensus: HF activity enhances market quality and lowers volatility. • Quote volatility results are less uniform.
Connection to realized volatility literature • Realized volatility = summed (absolute/squared) price changes. • Andersen, Bollerslev, Diebold and Ebens (2001), and others • Hansen and Lunde (2006) advocate pre-averaging to eliminate microstructure noise. • Present paper: “Don’t throw out the noise!”
Open questions • Analysis in this paper focuses on average HF volatility. • But HFQ is marked by extreme and interesting outliers. • What are the strategies? • Are the HFQ episodes cases of “dueling algos”? Or • Are they sensible strategies to detect and access liquidity? • Wavelet signal processing methods show great promise in isolating strategic microstructure effects from long-term information noise.