Download
1 / 57
580 likes | 808 Vues
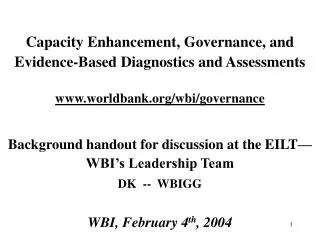
Capacity Enhancement, Governance, and Evidence-Based Diagnostics and Assessments www.worldbank.org/wbi/governance. Background handout for discussion at the EILT—WBI’s Leadership Team DK -- WBIGG WBI, February 4 th , 2004. Institutions &Governance Matters.

E N D
Capacity Enhancement, Governance, and Evidence-Based Diagnostics and Assessmentswww.worldbank.org/wbi/governance Background handout for discussion at the EILT—WBI’s Leadership Team DK -- WBIGG WBI, February 4th, 2004
Institutions &Governance Matters • Missing Link in Washington Consensus • First Summers’ Lesson from Experience • Governance as the weak link in CB/CE • ‘Data Power’: governance key for development • Yet 5 main challenges about institutions: i) which ones? (prioritizing among institutions & vulnerabilities Diagnostics); ii) how to? (Implementation Expertise); iii) where to? (Sectoral Mainstreaming) iv) measure, monitor, research Lessons v) Localize Know-how and Action Programs
Governance World Map :Control of Corruption, 2002 Source for data: http://www.worldbank.org/wbi/governance/govdata2002 ; Map downloaded from : http://info.worldbank.org/governance/kkz2002/govmap.asp Colors are assigned according to the following criteria: Red, 25% or less rank worse ( bottom 10% in darker red); Orange, between 25% and 50%; Yellow, between 50% and 75%; Light Green between 75% and 90% ; Dark Green above 90%
Where is Financial Aid Well Used, Where Wasted?Global Poll (% firms rating satisfactory [6-10]) % firms rating satisfactory
Listening to Stakeholders: Analysis of Responses on Donor Aid and Anti-Corruption Figure 9d : Most Important Role for Donors in Helping Country on Anti-Corruption (A-C)
Anti-Corruption Focus and Quality Assessment by the World Bank Global Poll Respondents, by extent of Corruption in Country(% firms rating satisfactory [6-10]) % firms rating satisfactory
Figure 8a: Firms evaluate World Bank’s effectiveness in PSD: Governance does matter (Survey, Emerging Economy sample) Note: The vertical axis depicts the firms’ net effectiveness evaluation of World Bank’s performance in supporting private-sector development (PSD) in their country. Net effectiveness is calculated as the difference between the percent of respondents reporting the institution to be effective minus the percent of respondents reporting it to be ineffective. Each set of two columns displays the net effectiveness ratings provided by countries with a good record in given constraint (in blue) versus those provided by countries with a poor performance in such constraint (in black). Calculations are based on country averages. Source: Executive Opinion Survey (GCR) 2002.
Corporate Governance and Corporate Ethics % firms rate satisfactory Corporate Governance Corporate Ethics Source: EOS 2002-03.
Soundness of Banks vs. Control of Corruption Sound Relatively Unsound Source: Executive Opinon Survey 2002; KKZ 2000/01Governance Indicators, http://www.worldbank.org/wbi/governance/govdata2001.htm The Sample of 80 countries has been divided into 3 sub-samples according to their rating in Control of Corruption. The 3 columns therefore represent the average ratings for Soundness of Banks within each sub-sample. The fitted line instead represents the predicted value of Bank Soundness controlling for the effects of GDP per capita and Regulatory Quality through an OLS regression. Each fitted value is computed as the sum of the estimated constant plus the value of Control of Corruption within each group times the estimated coefficient plus the mean values of Regulatory Quality and GDP per capita times their respective estimated coefficients.
Transparency, Parliaments, Corporate Ethics, and GDP Growth Annual GDP Growth (%) Source: Annual GDP growth over 1999-2001 WDI 2002; GDP is computed in PPP terms. The various transparency / governance variables drawn from Executive Opinion Survey, 2002.
Kenya – the ‘Mezzo’ Level of CE Assessment – 22 clusters Source: EOS 2003 WEF, preliminary. Percentile ranks based on comparative performance among the 103 countries in the sample. All variables rated from 0 (very bad) to 100 (excellent).
Health Gap vs. ‘Active’ Capture (High Level Corruption) Large Gap r = 0.83 Small High Bribery Low Source: EOS 2003
Institutional Capacity:From revisiting ‘Capacity Building’ to Measuring and Diagnosing Capacity Enhancement Institutional Capacity (IC) unbundling into 3 dimensions: • Physical capital and hardware (physical infrastructure, computers, etc.) (K); • Human and knowledge capital (including organizational & administrative capital, i.e. the ‘institutional software’) (HK), and, • Governance and political capital (GPK). IC = f (K, HK, GPK) Capacity Enhancement = Changed capacity over time
Empirical Approach to Institutional and Governance Assessments and Diagnostics • ‘Macro’: Worldwide Aggregate Governance Indicators: 200 countries, 6 components, periodic – it permits broad proxy of governance and capacity enhancement • ‘Mezzo’ (Middle): Cross-Country Surveys of Enterprises • ‘Micro’: Specialized, in-depth, in-country Governance and Institutional Capacity Diagnostics: Includes surveys of: i) user of public services (citizens); ii) firms, and iii) public officials Item #1 above is central for comparative monitoring worldwide and to ‘flag’ a country’s institutional vulnerabilities. On other extreme, item #3 is in-depth input to concrete capacity enhancement strategy at country level. Due to improvements in cross-country enterprise surveys, item #2 provides a relatively detailed quantitative sense of institutional vulnerabilities, complementary to the other 2.
Overall Evidence is Sobering:Progress on Governance is modest at best, so far Evidence points to slow, if any, average progress worldwide on key dimensions of governance This contrasts with some other developmental dimensions (e.g. quality of infrastructure; quality of math/science education; effective absorption of new technologies), where progress is apparent At the same time, substantial variation cross-country, even within a region. Some successes. And it is early days.
Capacity Enhancement Assessment, Level I:The ‘Macro’ or Aggregate Governance Indicators+ • Some Illustrations from updated Governance Indicators database: 200 countries, 1996-2002, to be continued
Governance: A working definition – which contains much of what is relevant for CE • Governance is the process and institutions by which authority in a country is exercised: (1) S -- the process by which governments are selected, held accountable, monitored, and replaced; (2) E -- the capacity of gov’t to manage resources and provide services efficiently, and to formulate and implement sound policies and regulations; and, (3) R -- the respect for the institutions that govern economic and social interactions among them
Operationalizing Governance: Unbundling its Definition into Components that can be measured, analyzed, and worked on Each of the 3 main components of Governance Definition is unbundled into 2 subcomponents: • Voice and External Accountability • Political Stability and lack of Violence&Terror • Quality Regulatory Framework • Government Effectiveness • Control of Corruption • Rule of Law We measure these six governance components…
Publisher Publication Source Country Coverage • Wefa’s DRI/McGraw-Hill Country Risk Review Poll 117 developed and developing • Business Env. Risk Intelligence BERI Survey 50/115 developed and developing • Columbia UniversityColumbia U. State Failure Poll 84 developed and developing • World Bank Country Policy & Institution Assmnt Poll 136 developing • Gallup International Voice of the People Survey 47 developed and developing • Business Env. Risk Intelligence BERI Survey 50/115 developed and developing • EBRD Transition Report Poll 27 transition economies • Economist Intelligence Unit Country Indicators Poll 115 developed and developing • Freedom House Freedom in the World Poll 192 developed and developing • Freedom House Nations in Transit Poll 27 transition economies • World Economic Forum/CID Global Competitiveness Survey 80 developed and developing • Heritage Foundation Economic Freedom Index Poll 156 developed and developing • Latino-barometro LBO Survey 17 developing • Political Risk Services International Country Risk Guide Poll 140 developed and developing • Reporters Without Borders Reporters sans frontieres (RSF) Survey 138 developed and developing • World Bank/EBRD BEEPS Survey 27 transition economies • IMD, Lausanne World Competitiveness Yearbook Survey 49 developed and developing • Binghamton Univ. Human Rights Violations Research Survey 140 developed and developing Inputs for Governance Indicators 2002
Control of Corruption: one Aggregate Indicator (selected countries, for illustration, based on 2000/01 research data) Good Corruption Control Margin of Error Corruption Level POOR GOOD Source: KKZ 2000/01
Governance World Map :Voice and Accountability, 2002 Source for data: http://www.worldbank.org/wbi/governance/govdata2002 ; Map downloaded from : http://info.worldbank.org/governance/kkz2002/govmap.asp Colors are assigned according to the following criteria: Red, 25% or less rank worse ( bottom 10% in darker red); Orange, between 25% and 50%; Yellow, between 50% and 75%; Light Green between 75% and 90% ; Dark Green above 90%
Governance World Map :Government Effectiveness, 2002 Source for data: http://www.worldbank.org/wbi/governance/govdata2002 ; Map downloaded from : http://info.worldbank.org/governance/kkz2002/govmap.asp Colors are assigned according to the following criteria: Red, 25% or less rank worse ( bottom 10% in darker red); Orange, between 25% and 50%; Yellow, between 50% and 75%; Light Green between 75% and 90% ; Dark Green above 90%
Governance World Map:Regulatory Quality, 2002 Source for data: http://www.worldbank.org/wbi/governance/govdata2002 ; Map downloaded from : http://info.worldbank.org/governance/kkz2002/govmap.asp Colors are assigned according to the following criteria: Red, 25% or less rank worse ( bottom 10% in darker red); Orange, between 25% and 50%; Yellow, between 50% and 75%; Light Green between 75% and 90% ; Dark Green above 90%
Governance World Map :Rule of Law, 2002 Source for data: http://www.worldbank.org/wbi/governance/govdata2002 ; Map downloaded from : http://info.worldbank.org/governance/kkz2002/govmap.asp Colors are assigned according to the following criteria: Red, 25% or less rank worse ( bottom 10% in darker red); Orange, between 25% and 50%; Yellow, between 50% and 75%; Light Green between 75% and 90% ; Dark Green above 90%
Governance Indicators: Chile 1998 vs. 2002 Source for data: http://www.worldbank.org/wbi/governance/govdata2002 ; Colors are assigned according to the following criteria: Dark Red, bottom 10th percentile rank; Light Red between 10th and 25th ; Orange, between 25th and 50th ; Yellow, between 50th and 75th ; Light Green between 75th and 90th ; Dark Green above 90th.
Governance Indicators: Kenya, 1996-2002 Source for data: http://www.worldbank.org/wbi/governance/govdata2002 ; Colors are assigned according to the following criteria: Dark Red, bottom 10th percentile rank; Light Red between 10th and 25th ; Orange, between 25th and 50th ; Yellow, between 50th and 75th ; Light Green between 75th and 90th ; Dark Green above 90th.
Another ‘Macro’ Evidence-Based approach at WBI—KAM Kenya : Knowledge Economy Indexes and Pillars Source: KAM website (www.worldbank.org/kam) – Basic Scorecard mode
Knowledge Economy Index and pillar contribution Souce: KAM website (www.worldbank.org/kam) – Cross country comparison mode
2nd Level: The ‘Mezzo’ Empirical Assessment • More detailed institutional vulnerability assessment possible • Comparative across over 100 countries • Annually • Cluster Comparative Analysis permits identification of (relative) vulnerabilities • Illustrating Kenya and Chile
Kenya – the ‘Mezzo’ Level of CE Assessment – 22 clusters Source: EOS 2003 WEF, preliminary. Percentile ranks based on comparative performance among the 103 countries in the sample. All variables rated from 0 (very bad) to 100 (excellent).
Chile – the ‘Mezzo’ Level of CE Assessment; 22 clusters Source: EOS 2003 WEF, preliminary. Percentile ranks based on comparative performance among the 103 countries in the sample. All variables rated from 0 (very bad) to 100 (excellent).
Politics Can be Measured as Well, and it Matters Inequality of Influence: a major governance challenge
3rd Level: Country Diagnostics • Key to Localize Know-how • Key Input to Action program, Monitoring • One country at the time; staff and resource intensive
Key Features of 3-survey Governance, Anticorruption and Institutional Diagnostics • Three surveys: households, firms, and public officials [‘triangulation’] • Questions can be chosen to focus on experience and/orperceptions • Specially designed and tested closed questions, thoroughly piloted and adapted to local realities • Rigorous technical requirements in implementation • Local institution implements, with World Bank guidance • Recognizes multidimensionality of governance
Type of information elicited (1) • Households • Experience on interactions with state bodies for health care, education, driver’s licence, police, courts, social benefits, and other agencies • Payments solicited, where, how much and how frequently • Clarification of what people consider to be corruption, perceptions of levels, their sources of information on corruption, extent of knowledge of their rights, duties, and possible recourse
Type of information elicited (2) • Enterprises • Experience with customs, tax, procurement, courts, inspections, licences and permits • Payments solicited, where, how frequently, how much paid • Quality of govt. services, level of red tape • Ways in which firms make their views known (e.g. through business associations) • Private sector perspectives on state initiatives
Type of information elicited (3) • Public officials • How hiring and firing decisions are made • How “mission-oriented” the body is • What complaint mechanisms or public consultations exist • What types of problem and risks officials perceive as the worst affecting their organizations
Implementation steps (1) • Define objectives, scope, terms of reference • Issue tender for work by local firm/institution • Review existing standard questionnaires and adapt to local objectives and conditions, commission review by local experts before questionnaire finalized • Determine size of sample relative to degree of stratification desired: e.g. by region, sector, size/type of firm, income level; for public officials, level of govt., seniority level, sectors (e.g. health and education); SOEs?
Implementation steps (2) • Sample size: usually a minimum of 1000 households, 400 enterprises, 400 officials • Pilot in variety of situations (e.g. urban/rural, high income/low income) and review results, discuss quality of results with focus groups • Be prepared to revise radically or abandon if data quality too poor • Launch surveys (face-to-face more effective than mail or telephone) • Respondents must feel confident of anonymity if results are to be reliable
Implementation steps (3) • Code data, produce statistical transformations, graphs • Analyze and write up for draft report • Usually discuss with focus groups to bring out underlying issues • Resources needed ? Depends on local costs, size of survey (was $60,000 in several ECA countries) • Time taken: 6-9 months
The power of diagnostic data and key dimensions for analysis • Unbundle corruption by type – administrative level corruption, capture of the state, bidding, theft of goods and public resources, purchase of licenses and regulations • Identify both weak institutions (in need of reform) and strong institutions (example of good governance)
The power of diagnostic data and key dimensions for analysis (con’t) • Assess the cost of each type of corruption on different social and economic groups • Identify key determinants of good governance • Help to develop policy recommendations The reality of institutional vulnerabilities vary greatly from country to country… some illustrations from diagnostics...
The “Bribe Fee List” Unofficial Payments by Enterprises for Official Licenses and Services, Ukraine and Russia 1996 Average "unofficial" fee required for “favor” "Unofficial fee": type of license/"favor" Russia Ukraine $ 288 $ 176 Enterprise registration $ 67 $ 42 Each visit by fire/health inspector $ 250 $ 87 Tax inspector (each regular visit) $ 1,071 $ 894 Each phone line installation Lease in state space (sq. meter per month) $ 26 $ 7 Each export registration/consignment $ 643 $ 123 Each import registration/consignment $ 133 $ 278 8% 4% Domestic currency loan from bank (preferential terms) 23% 4% Hard currency loan (preferential terms)
Misgoverned vs. well Governed Agencies in Ecuador (as ranked by public officials, 2000 diagnostic)
Understanding Causal Factors in CE and Governance Underperformance • Illustrating the extent to which political determinants, meritocracy, transparency, and voice and accountability matters
New Diagnostic Tools permit measuring important dimensions of capacity – illustration #1 from Bolivia diagnostics: How Politicized Agencies exhibit Budgetary Leakages Yellow columns depict the unconditional average for each category. Blue line depicts the controlled causal effect from X to Y variables. Dotted red lines depict the confidence ranges around the causal effect depicted by the blue line.
Illustration of empirical analysis based on diagnostic: Users’ Feedback to Public Agencies Helps Control Bribery Based on 90 national, departmental, and municipal agencies covered in the Bolivia Public Officials Survey.
Citizen Voice Improves Accessibility of Public Services to the Poor Based on Public Officials Survey. The sample of institutions includes 44 national, departmental, and municipal agencies which are a prior anticipated to be accessible to the poor