Download

1 / 85
850 likes | 1.03k Vues
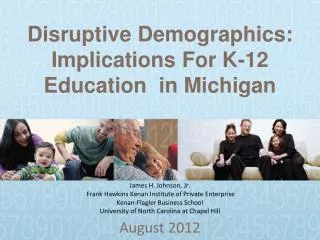
December 2012. Disruptive Demographics and North Carolina’s Education Challenges . James H. Johnson, Jr. Frank Hawkins Kenan Institute of Private Enterprise Kenan-Flagler Business School University of North Carolina at Chapel Hill. OVERVIEW. Demographic Trends

E N D
December 2012 Disruptive Demographics and North Carolina’s Education Challenges James H. Johnson, Jr. Frank Hawkins Kenan Institute of Private Enterprise Kenan-Flagler Business School University of North Carolina at Chapel Hill
OVERVIEW • Demographic Trends • Challenges & Opportunities • Discussion
CENSUS 2010 what will REVEAL December 2012
6 DISRUPTIVE TRENDS • The South Rises – Again • The Browning of America • Marrying Out is “In” • The Silver Tsunami is About to Hit • The End of Men? • Cooling Water from Grandma’s Well… and Grandpa’s Too!
The South Continues To Rise ...Again!
SOUTH’S SHARE OF U.S. NET POPULATION GROWTH, SELECTED YEARS, 1910-2010
NET MIGRATION TRENDS, 2000-2008 = Net Import = Net Export
NC COUNTIES WITH THE LARGEST ABSOLUTE POPULATION GAINS, 2000-2010
IMMIGRATION POPULATION, 1900-2007 Source: Center for Immigration Studies; U.S. Census Bureau, Current Population Survey
NORTH CAROLINA POPULATION GROWTH BY NATIVITY, RACE, AND ETHNICITY, 1990-2007
CONTRIBUTIONS OF NON-WHITES & HISPANICS TO NC POPULATION CHANGE, 2000-2010 Source: Census 2000 and Census 2010. *Non-whites include Blacks, Hispanics, American Indians and Alaskan Natives, Asians, Native Hawaiians & Pacific Islanders, and people of two or more races.
Marrying Out is “In”
INTERMARRIAGE TREND, 1980-2008 % Married Someone of a Different Race/Ethnicity
INTERMARRIAGE TYPES Newly Married Couples in 2008
MEDIAN AGE & FERTILITY RATES FOR FEMALES IN NC, 2005-2009 . • Source: American Community Survey • *Women 15 to 50 with births in past 12 months
RELATIVE DISTRIBUTION OF U.S. BIRTHS BY RACE / ETHNICITY Source: Johnson and Lichter (2010); Tavernise (2011).
CHANGE IN THE RACE/ETHNIC COMPOSITION OF NC PUBLIC SCHOOLS, 2000-2009 . • Source: DPI, The Statistical Profile Online
U.S. POPULATION TURNING 50, 55, 62, AND 65 YEARS OF AGE, (2007-2015)
DEPENDENCY RATIOS IN THE AMERICAN SOUTH Source: Census 2010
COOLING WATERS FROM GRANDMA’S WELL And Grandpa’s Too!
Children Living in Non-Grandparent and Grandparent Households, 2001-2010
Children Living in Non-Grandparent and Grandparent-Headed Households by Presence of Parents, 2010
GRANDPARENTS LIVING WITH GRANDCHILDREN AGES 18 AND YOUNGER IN NORTH CAROLINA
JOBS LOST/GAINED BY GENDER DURING 2007 (Q4) – 2009 (Q3) RECESSION
THE PLIGHT OF MEN • Today, three times as many men of working age do not work at all compared to 1969. • Selective male withdrawal from labor market—rising non-employment due largely to skills mismatches, disabilities & incarceration. • The percentage of prime-aged men receiving disability insurance doubled between 1970 (2.4%) and 2009 (4.8%). • Since 1969 median wage of the American male has declined by almost $13,000 after accounting for inflation. • After peaking in 1977, male college completion rates have barely changed over the past 35 years.
UNC SYSTEM STUDENT ENROLLMENT BY GENDER AND TYPE OF INSTITUTION, 2010
Average EOG Scores Gender scores are averages of 6 LEAs (Bertie, Bladen, Halifax, Duplin, Northampton and Pamlico)
Average EOG Scores Gender scores are averages of 6 LEAs (Bertie, Bladen, Halifax, Duplin, Northampton and Pamlico)
Average EOC Scores Gender scores are averages of 6 LEAs (Bertie, Bladen, Halifax, Duplin, Northampton and Pamlico)
EOC Composite Scores Gender scores are averages of 6 LEAs (Bertie, Bladen, Halifax, Duplin, Northampton and Pamlico)
Male-Female Presence Disparity Graph shows total number of male and female students tested of 6 LEAs (Bertie, Bladen, Duplin, Halifax, Northampton, and Pamlico)