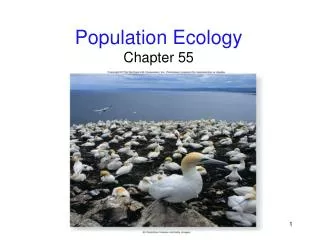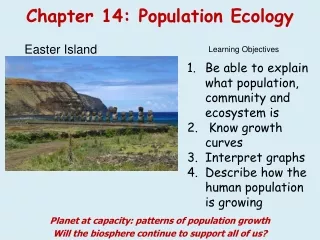
Understanding Population Ecology: Dynamics and Growth Patterns of Canada Geese
500 likes | 621 Vues
This chapter explores population ecology using Canada geese as a primary example. It highlights the differences between migratory and non-migratory populations, emphasizing the increasing numbers of non-migratory geese in the U.S. Wildlife managers seek strategies to control these populations while protecting migratory birds. The chapter covers demographic studies, sampling techniques for estimating population sizes, and various population structures such as clumped, uniform, and random distributions. Additionally, it discusses growth rates and the factors impacting population changes, illustrating these concepts with practical examples.

Understanding Population Ecology: Dynamics and Growth Patterns of Canada Geese
E N D
Presentation Transcript
40.1 A Honking Mess • Several different Canada goose populations spend time in the US – some migrate, some do not • Nonmigratory populations devote more energy to producing young, and their numbers are increasing • Wildlife mangers are looking for ways to reduce nonmigratory goose populations, without harming migratory birds • population • Group of organisms of the same species that live in the same area and interbreed
Goose Troubles • US Airways Flight 1549 floats in the Hudson River after collisions with geese incapacitated both of its engines
40.2 Population Demographics • Ecological factors affect the size, density, distribution, and age structure of a population • Studying population ecology often involves the use of demographics, which often change over time • demographics • Statistics that describe a population
Population Size • Biologists frequently use sampling techniques to estimate population size • Plot sampling estimates the total number of individuals in an area based on direct counts in a small portion of that area • Estimates from plot sampling are most accurate when the organisms counted are not very mobile and conditions across the area they occupy are more or less uniform
Key Terms • population size • Total number of individuals in a population • plot sampling • Method of estimating population size of organisms that do not move much by making counts in small plots, and extrapolating from this to the number in the larger area
Population Size (cont.) • Scientists use mark-recapture sampling to estimate the population size of mobile animals, such as Florida Key deer • mark-recapture sampling • Method of estimating population size of mobile animals by marking individuals, releasing them, then checking the proportion of marks among individuals recaptured at a later time
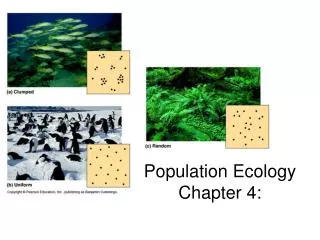
Population Density and Distribution • population density • Number of individuals per unit area or volume • Example: Number of dandelions per square meter of lawn • population distribution • Describes how individuals are distributed • Individuals may be clumped, uniformly dispersed, or randomly dispersed in an area
Clumped Distribution • Individuals are closer to one another than would be predicted by chance alone • Due to resource distribution, limited dispersal availability, or asexual reproduction
Near-Uniform Distribution • Individuals are more evenly spaced than would be expected by chance • Found in breeding colonies, and with competition for resources
Random Distribution • Individuals are distributed randomly when environmental resources are uniformly distributed, and proximity to others is neither beneficial nor harmful
Age Structure • Individuals in a population are frequently grouped as pre-reproductive, reproductive, or post-reproductive • age structure • Of a population, the number of individuals in each of several age categories • reproductive base • Of a population, all individuals who are of reproductive age or younger
Effects of Scale and Timing • The scale of the area sampled and the timing of a study can influence the observed demographics • Example: Seabirds crowd together during the breeding season, but disperse when breeding is over • Wildlife managers use demographic information to decide how best to manage populations
Key Concepts • The Vital Statistics • Ecologists explain population growth in terms of population size, density, distribution, and number of individuals in different age categories • They have methods of estimating population size and density in the field
ANIMATION: Mark-Recapture Method To play movie you must be in Slide Show Mode PC Users: Please wait for content to load, then click to play Mac Users: CLICK HERE
40.3 Population Size and Exponential Growth • The number of individuals in a population is increased by births and immigration, and decreased by deaths and emigration • immigration • Movement of individuals into a population • emigration • Movement of individuals out of a population
From Zero to Exponential Growth • Apart from immigration and emigration, an interval in which population size remains unchanged, with no net increase or decrease in the number of individuals, is called zero population growth • zero population growth • Interval in which births equal deaths
Growth Rate (r) • We can measure births and deaths in terms of rates per individual, or per capita • Per capita growth rate (r) = per capita bith rate (b) – per capita dreath rate (d) • per capita growth rate (r) • For some interval, the added number of individuals divided by the initial population size
Exponential Growth (cont.) • Example: 2,000 mice live in the same cornfield: • 1,000 mice are born each month • Birth rate is 0.5 births per mouse per month (1,000/2,000) • 200 mice die each month • Death rate is 0.1 deaths per mouse per month (200/2,000) • r is 0.4 per mouse per month (0.5 – 0.1)
Exponential Growth • As long as r remains constant and greater than zero, exponential growth will occur • A population grows exponentially as long as birth rate (b) is greater than death rate (d) • exponential growth • A population grows by a fixed percentage in successive time intervals; the size of each increase is determined by the current population size
Exponential Growth (cont.) • We calculate population growth (G ) based on the per capita growth rate and the number of individuals (N ): Population growth rate (G) = per capita growth rate (r) X number of individuals (N) • With exponential growth, a plot of population increases against time produces a J-shaped curve – number of new individuals increases each generation, although per capita growth rate stays the same
Example: Effect of Death Rates • Two populations of bacteria: Population 1 divides every half hour; population 2 divides every half hour, with 25% dying between divisions – exponential growth continues
What Is the Biotic Potential? • Under ideal conditions (shelter, food, and other essential resources are unlimited, no predators or pathogens) a population’s growth rate reaches its biotic potential • Microbes have high biotic potentials; large-bodied mammals have low biotic potentials • biotic potential • Maximum possible population growth rate under optimal conditions
Key Concepts • Exponential Rates of Growth • A population’s size and reproductive base influence its rate of growth • As long as births exceed deaths, a population will grow exponentially • Each generation will be larger than the preceding one
ANIMATION: Patterns of Population growth To play movie you must be in Slide Show Mode PC Users: Please wait for content to load, then click to play Mac Users: CLICK HERE
40.4 Limits on Population Growth • Populations seldom reach their biotic potential because of the effects of limiting factors • Many complex interactions take place within and between populations in nature, and it is not always easy to identify all the factors that can restrict population growth • limiting factor • A necessary resource, the depletion of which halts population growth
Environmental Limits on Growth • Essential resources such as food, mineral ions, refuge from predators, and safe nesting sites are examples of limiting factors for population growth • In any environment, one essential factor will run out first, and acts as the brake on population growth • Supplying the first limiting factors simply substitutes one for another – all natural populations eventually encounter limits
Carrying Capacity • A given environment can sustain only a certain number of individuals in a population indefinitely – ultimately, the sustainable supply of resources determines population size • carrying capacity • Maximum number of individuals of a species that an environment can sustain
Logistic Growth • A pattern of logistic growthshows how a small population starts growing slowly in size, then grows rapidly, then levels off as the carrying capacity is reached • Logistic growth plots out as an S-shaped curve • logistic growth • A population grows slowly, then increases rapidly until it reaches carrying capacity and levels off
Two Categories of Limiting Factors • Factors that affect population growth fall into two categories • density-dependent factor • Factor that limits population growth and has a greater effect in dense populations than less dense ones • Example: Pathogens and parasites • density-independent factor • Factor that limits population growth and arises regardless of population density • Example: Fires and earthquakes
Example: Overshoot and Crash • 1944: 29 reindeer were introduced to St. Matthew Island • 1957: 1,350 well-fed reindeer munching on lichens • 1963: 6,000 hungry reindeer (carry capacity exceeded) • 1966: 42 live reindeer, and many bleached bones • 1980s: No reindeer
Key Concepts • Limits on Increases in Size • Density dependent factors such as competition for resources lead to logistic growth • A population grows exponentially at first, then growth slows as the number approaches the environment’s carrying capacity
ANIMATION: Effect of Death on Growth To play movie you must be in Slide Show Mode PC Users: Please wait for content to load, then click to play Mac Users: CLICK HERE
40.5 Life History Patterns • Reproduction-related events that occur between birth and death make up a life history pattern • life history pattern • A set of traits related to growth, survival, and reproduction such as life span, age-specific mortality, age at first reproduction, and number of breeding events
Patterns of Survival and Reproduction • We study life history traits within a population by recording what happens to a specific cohort • Human life-expectancy tables are usually based on information about current conditions rather than a real cohort • cohort • Group of individuals born during the same interval
Patterns (cont.) • Information about age-specific death rates can also be summarized by a survivorship curve, which shows how many members of a cohort remain alive over time • Three types of survivorship curves are common • survivorship curve • Graph showing the decline in numbers of a cohort over time
Type I Survivorship Curve • Elephants have type I survivorship, with low mortality until old age • Typical of large animals that bear one or few offspring at a time and provide extended parental care
Type II Survivorship Curve • Snowy egrets are type II population, with a fairly constant death rate • Typical of lizards, small mammals, and large birds
Type III Survivorship Curve • Sea urchins are type III; mortality is high for larvae and in old age, but low in adults • Typical of species that produce many small offspring and provide little or no parental care
Allocating Reproductive Investment • Natural selection influences the timing of reproduction and how much a parent invests in each offspring • The most adaptive reproductive strategy is that which maximizes a parent’s lifetime reproductive success • Reproduction involves trade-offs between offspring quality and quantity – the most effective reproductive strategy can vary with population density
Allocating Reproductive Investment • r-selection • Individuals who produce maximum number offspring as quickly as possible have a selective advantage • Occurs when population density is low and resources are abundant • K-selection • Individuals who produce offspring that outcompete others for limited resources have a selective advantage • Occurs when a population is near carrying capacity
Key Concepts • Patterns of Survival and Reproduction • Life history traits such as age at first reproduction and number of offspring per reproductive event vary and are shaped by natural selection • Adaptive life history traits are those that maximize an individual’s lifetime reproductive success
ANIMATION: Life History Patterns To play movie you must be in Slide Show Mode PC Users: Please wait for content to load, then click to play Mac Users: CLICK HERE