Student Achievement Data
Student Achievement Data. A first look at MPC’s institution-set standards Rosaleen Ryan, Institutional Researcher Catherine Webb, Accreditation Liaison Officer 23 September 2014. What are Institution-set Standards?. Internal baselines for student achievement

Student Achievement Data
E N D
Presentation Transcript
Student Achievement Data A first look at MPC’s institution-set standards Rosaleen Ryan, Institutional Researcher Catherine Webb, Accreditation Liaison Officer 23 September 2014
What are Institution-set Standards? • Internal baselines for student achievement • Early indicators of areas that may need closer attention from the institution • One method for determining whether we are accomplishing our mission • US Department of Education requirements
What are the requirements for institutions? US Dept. of Education requires institutions to: • Set internal standards (i.e., baselines) for student achievement • Assess institutional performance against these baselines • Use this assessment to set goals for improvement when baselines aren’t met
What are the requirements for accreditors? US Dept. of Education requires accreditors to: • Ensure compliance with USDE requirements • Evaluate the reasonableness of the internal standards (i.e., baselines) set by an institution • Evaluate the effectiveness of the institution’s use of its baselines in its planning
What data must be included? Institutions must set baselines for: • Course completion rate • Degree awards • Certificate awards • Transfers • Licensure pass rates (if applicable)
What other data should be considered? Institutions should also set baselines for: • Other areas of student achievement relevant to institutional missionFor example: • Job placement rates for CTE programs, if applicable • Retention (i.e., Fall to Fall persistence) • DE success rates, if applicable
Principles for setting our baselines Institution-set standards should be: • Baselines, not aspirational goals • Reasonable and reflective of our “normal” range • Flexible enough to account for any unforeseen circumstances • Easy to calculate and understand
Methodology for setting our baselines In Spring 2014, we decided to: • Start with a five-year average for each metric • Look at the variability around the average to find the “range of normal” (i.e., the standard deviation) for the five-year span • Set the standard at the lower edge of the range
Example: setting a baseline for dog height • Green line = Average height of our five dogs • Purple area = standard deviation from the average • Baseline for dog height = lower blue line
Today we’ll look at: • Course completion rate • Degree awards • Certificate awards • Transfers
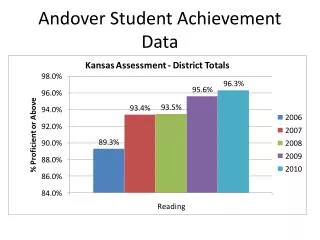
Course Completion Rate Defined as: Course success count ÷ Course enrollment count Data Source: CCCCO DataMart, Retention/Success Rate Report Five-Year Mean: 71.5% less Standard Deviation:- 2.1% Current standard: 69.4%
Degree Completion, Part 1 Defined as: Number of degrees awarded Data Source: CCCCO DataMart, Program Awards Report (Degrees); MIS Referential Files (Students) Five-Year Mean: 384.0 less Standard Deviation:- 36.8 347.2 Current standard: 347
Degree Completion, Part 2 Defined as: Number of students (unduplicated) receiving a degree Data Source: CCCCO DataMart, Program Awards Report (Degrees); MIS Referential Files (Students) Five-Year Mean: 356.6 less Standard Deviation:- 029.1 327.5 Current standard:327
Certificate Completion, Part 1 Defined as: Number of certificates awarded Data Source: CCCCO DataMart, Program Awards Report (Degrees); MIS Referential Files (Students) Five-Year Mean: 68.8 less Standard Deviation:- 29.0 39.8 Current standard: 39
Certificate Completion, Part 2 Defined as: Number of students (unduplicated) receiving a certificate Data Source: CCCCO DataMart, Program Awards Report (Degrees); MIS Referential Files (Students) Five-Year Mean: 65.0 less Standard Deviation:- 27.1 37.9 Current standard: 37
Transfer to 4-year College or University Defined as: Number of students who successfully transfer to a 4-year Data Sources: CCCCO DataMart Transfer Volume (ISP, OOS); CSU Analytic Studies (CSU), CCCCO Student Services Transfer and Articulation (UC) Five-Year Mean: 493.2 less Standard Deviation:- 067.3 425.9 Current standard: 425
Next steps • Calculate current standards for remaining categories(e.g., retention, licensure pass rate, job placement rates for CTE programs, DE success rates, etc.) • Identify any other internal areas for which a baseline would be helpful (and calculate those)(e.g., FTES, Success rates in GE and/or CTE, % of students assessing into Basic Skills courses that complete Basic Skills courses) • Disaggregate the data to examine trends • By student population group (in order to identify any performance gaps) • By program (to aid in Program Review) • By instructional modality (to provide information about online learning)