Plant Transpiration Experiment: Normalization Methods and Parameters Development
260 likes | 395 Vues
This experiment assesses normalization methods for plant transpiration values, comparing plant properties with various parameters for selection and research. The study explores factors like leaf area, fresh weight, and dry weight to determine their correlation with transpiration rates in plants. The results indicate the importance of considering plant structure and leaf orientation in determining transpiration values. The experiment also examines water use efficiency measurement and analyzes transpiration during salt irrigation. The findings aim to enhance understanding of plant transpiration and its relation to environmental factors.

Plant Transpiration Experiment: Normalization Methods and Parameters Development
E N D
Presentation Transcript
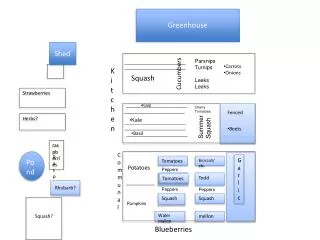
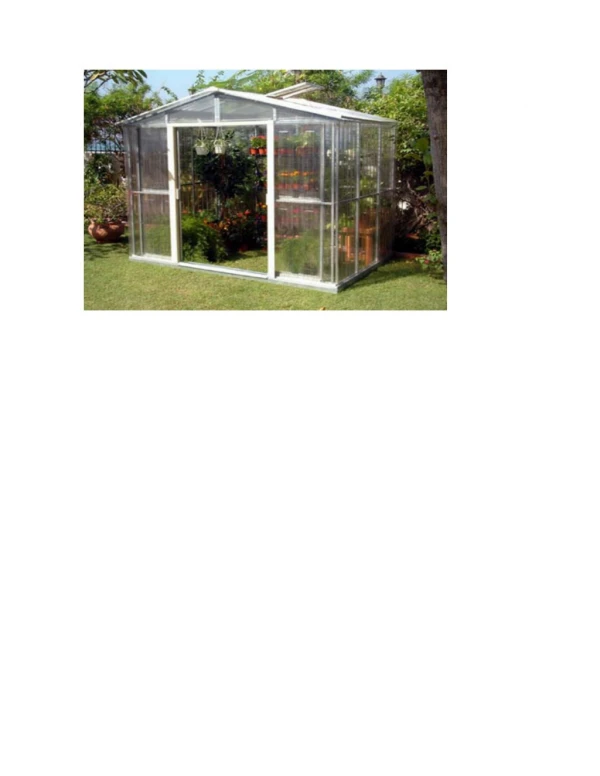
Greenhouse Experiment Purpose : Checking Lysimeters system compatibility, and developing parameters for plant selection Written by Asipov Leonid
Environmental Normalization • Rationale : Plant transpiration is greatly affected by environmental factors. To compare plants that were measured at different time, transpiration values should be normalized. • Method : We’ll try to normalize using passive evaporation from bowl of water. • Lead Question : How does bowl evaporation correlate with plant transpiration?
Good correlation between plant transpiration and bowl evaporation • Not exact linearity suggests difference in response to environment between the plants and passive evaporation. Should humidity, irradiation and temperature measurement give more exact normalization?
At days with little evaporation (less then 4 g/hour) of the bowl, normalization by bowl of water will be inaccurate and tend to enlarge the transpiration : evaporation ratio.
Between plants normalization : is it needed? • Needed for comparing plant properties without recognition to plant actual size or structure, like it’s properties on cellular level. • A quantitative replacement for plant size has to have linear correlation with the compared property. • We’ll compare different plant normalization options : leaf area, fresh weight, dry weight
No correlation between plant fresh weight and transpiration . Fruit and different stem structure might be the reason?
No plant normalization parameter appears to correlate well with transpiration. The highest attainable correlation is from leaf area. But does reflect equally plant transpiration at it’s different values?
From this chart we can conclude that the more leaf area a plant has, the less it transpires to leaf area. Explanation might be leaf shading. Bigger plants have relatively more leaf area then smaller plants but their leaves are more shaded and thus average transpiration to leaf area is smaller in bigger plants.
Plant Normalization • Plant structure and leaf orientation in space affect on overall transpiration. Such effects are neglected if simple normalization with overall leaf area is done. • If plant transpiration reflect the exposed to light leaves area, why should we normalize? Why should we neglect plant size, if we want to select plants by their growth ability? • If plant total transpiration can be a degree for leaf total area exposed to light, plants with higher transpiration, after growing in same conditions are the plants we look after. Proposition : Not normalize between plants due to non-linearity of the leaf area factor in relation to transpiration. Research on the level of whole plant might speak more about how plant’s macrostructure (like leaf orientation, density ) affects overall properties. Less about microstructure (cellular properties, structure on basis of single leaf where we neglect the relations between all the leaves).
Experiment Results : Comparing Plant Transpiration • Assuming that the transpiration : evaporation ratio of a plant is a function of a total leaf area exposed to light (in totally arbitrary units), plants with larger ratio, are either larger plants or make more transpiration / leaf area. We have to assume that plants were grown in equal conditions from the start, and their transpiration : evaporation ratio is a function of their growth ability. • We will look on the whole plant capable of making transpiration at some extent, without importance to the reason to it.
Water Use Efficiency Measurement • Calculation of water use efficiency can be made from weight gain and transpiration. • Weight gain can be biomass gain (new tissues formation) or accumulation of water (in the existing tissues, without actual dry weight growth).
Water Use Efficiency Measurement (continued) • Relatively large change in plant fresh weight (up to 120 g / day at some days) might be due to water accumulation. • Note that at the first day of the experiment (previous slide) there was the most weight gain. Possible reason is better irrigation for the measured plants(in the boxes) relatively to the not measured plants. • Root rot problems that occur due to the water layer in the box might be a reason for bad water transport for the plant at some days. There is no visible effect on transpiration during these days(data not shown), and this might be compensated by plant fresh weight loss(see Drought section later on). • Because of large fresh weight changes which are probably not reflect actual biomass growth, water use efficiency should be measured at longer time scale.
Analysis of Transpiration During Salt Irrigation • For assessing effect of irrigation with water containing NaCl at 100mM, we’ll calculate the ratio between average (normalized to evaporation) transpiration of four salt irrigated days to three normally irrigated days.
Groups which were affected by the salt less, rehabilitated better. Rehabilitation from salt depends on severity of the effect on a particular plant.
Drought • Lack of irrigation causes decrease in transpiration. • Plants with most transpiration will use most of the available water first and face stress sooner then plants with less transpiration.
Plant Fresh Weight Loss During Dehydration • Plants loose fresh weight during long and short dehydration periods. • Weight loss is well related to transpiration (next slide)
Average Daily Transpiration During the two Dehydration periods. Note, the plants which lost weight the most(previous slide), made the most transpiration.
Drought • Using the current experimental setup, since plants face drought at different extent, comparison between them won’t be accurate. • Hence for rehabilitation from drought. • Due to plant fresh weight change during drought, calculation of water use efficiency won’t be easily possible. • Looking at transpiration rate during dehydration we can clearly distinguish plants which are facing drought stress. • In the following figures we’ll see a clear pre-stress and stress transpiration pattern.
Drought • Possible solution for the drought experiment is individual approach for each plant. Since, transpiration rate shows pre-stress pattern, irrigation of each plant will be done just after such day. Later on, each plant individually will be compared according to rehabilitation ability.