Download
1 / 36
370 likes | 397 Vues
Explore the new VC10 tracer test method for determining t10 in water systems, discuss case studies, results, and applications. Learn about t10 and T definitions, hydraulic baffling factor, and the importance of tracer studies for water quality improvement. Discover how the VC10 approach can enhance operational efficiency and address challenges in water treatment processes.

E N D
Tracer Study - Cumulative Volume (VC10) Approach Guy Schott California Department of Public Health (CDPH) CA-NV AWWA, October 8, 2010 Sacramento, CA CDPH
Intent of Presentation • Discuss the Cumulative Volume10 (VC10) tracer test – A new method for determining t10 for non-steady-state flows • Discuss case studies using the VC10 tracer test method • Discuss results and application CDPH
Definitions • t10 – is defined as the amount of time it takes for 10% of a non-reactive material to pass through a basin • T: Theoretical Detention Time • t10/T: Short-Circuiting Factor or Hydraulic Baffling Factor • Step-Dose Test – a continuous feed of a non-reactive tracer chemical throughout a test • Ct10(mg/L * min).: Residual disinfectant concentration (mg/L) x t10 (min) New: • VC10: The cumulative volume of water that has exited the reactor from to to t10 when 10% of the tracer mass has exited the reactor. Or CDPH
Tracer Studies - Historically • EPA Standard method of tracer tests are commonly conducted at steady-state flows and constant tank volumes • One to three tests are conducted • High Demand • Normal Demand • Low, median, high or • Winter/summer flows • Studies are conducted until near or full tracer mass recovery (3-5 theoretical detention times) • Tracer material (Fluoride & Lithium) CDPH
If a Tracer Study is Not Conducted? • A conservative hydraulic baffling factor will be assigned by Primacy agency • Means higher disinfectant dosages that can lead to higher disinfectant byproducts and chemical cost • Possible increase in water quality complaints. • Ct10 calculations may be based on non-realistic operating parameters CDPH
When Standard Method of tracer testing cannot be conducted in accordance with EPA guidelines • Accept the baffling factor and operating conditions the primacy agency applies to your water system and the associated problems that comes with it Or – better yet • Devise a new tracer test method that will profile the disinfection contact time for the operation and configuration of that water system CDPH
Standard Method in Determining t10 in a Tracer Study (Step or Slug Dose Method) Flow • t10 is the time it takes for 10% of the tracer mass to exit the reactor at a steady-state flow and volume • T is the theoretical detention time of the reactor at a given steady-state flow and volume • t10/T is the short-circuiting or hydraulic baffling factor Volume Tracer Mass T = Volume/Flow Flow t10 = 10% of tracer mass (Sample Port) CDPH
Actual Operating Conditions for most Tracer Studies Flow1 • Inlet/Outlet flows are not the same (i.e., +/-10%) • Use exit flow • Variations in tank level or volume • Use average volume from t0 to t10 Volume Tracer Mass T = Avg Vol/Flow2 Flow2 t10 = 10% of tracer mass (Sample Port) CDPH
The Hydraulic Baffling Factor t10/T of Reactor Can Not Be Determined Using Standard Tracer Study Method If: • Basin Inlet/outlet flows are drastically different • Basin outlet flow is not operated at steady-state conditions • Supply pumps to distribution system are operated on system pressure (on/off operations, flows vary) • Plant is not continuously operated CDPH
Case Study of Three Plants • Treatment Plants are controlled by water level in clearwell • Clearwells are followed by booster pump and pressure tank • Booster or distribution supply pumps are controlled by system pressure • Five flow scenarios each plant experiences CDPH
Case Study of Three Plants – Typical Flow Diagram Sample Pt. Tracer Recorded delivered Volume of Water to t10 CDPH
Case Study of Three Plants – Flow 1 (Scenario 1) Sample Pt. 1 Tracer Recorded delivered Volume of Water to t10 CDPH
Case Study of Three Plants – Flows 1, 2 & 3 (Scenario 2) Sample Pt. 1 3 Tracer Recorded delivered Volume of Water to t10 2 CDPH
Case Study of Three Plants – Flows 2 & 3 (Scenario 3) Sample Pt. 3 Tracer Recorded delivered Volume of Water to t10 2 CDPH
Case Study of Three Plants – Flow 3 (Scenario 4) Sample Pt. 3 Tracer Recorded delivered Volume of Water to t10 CDPH
Case Study of Three Plants – Flows 1 & 3 (Scenario 5) Sample Pt. 1 3 Tracer Recorded delivered Volume of Water to t10 CDPH
At Issue -Elevated Disinfection Byproducts are due to: • Conservative hydraulic baffling factor assigned to clearwell requiring significant chlorine contact time • Steady-state/maximum flow capacity from booster pump assumed • Chlorine residual increased up to 4 mg/L to meet log inactivation of Giardia cyst • Result – TTHM/HAA5 elevated over MCL CDPH
Plan of Action to Describe Actual Hydraulic Conditions • How do we determine the actual residence time of the water before the first customer when hydraulic conditions are erratic? • Need to devise an alternative tracer method to describe actual operating conditions • Possible Solution - Relate time (t10) to delivered volume (VC10) CDPH
Derive Cumulative Volume Method from the Modified Step-Dose Method to Evaluate Hydraulic Conditions • Modified Step-Dose Method • Cumulative Volume10 (VC10) Method CDPH
Modified Step-Dose Method • Similar to Step-Dose Test • Differences: • Shorter test duration: tracer is discontinued when >10% of mass has exited reactor (< Theoretical Detention Time) • Allows for higher dosage (5 to 10 mg/L of F) • Increased analytical sensitivity at the 10% dose rate measurement • Test Application – suitable for long test duration under the Step-Dose test • Presented at the CA-NV AWWA Oct 25, 2007 CDPH
Cumulative Volume (VC10) Method • Relates t10 with cumulative exit volume (VC10) Where • VC10: The cumulative volume of water that has exited the reactor from to to t10 when 10% of the tracer mass has exited the reactor • t10 is the time associated with the VC10 and 10% of tracer mass CDPH
Determining VC10 & t10in a Tracer Study (VC10 method) Flow • VC10: is the total volume of water that has exited the reactor when 10% of the tracer mass has exited the reactor • t10 is the time it takes for 10% of the tracer mass to exit the reactor Volume Sample Port Tracer Mass FM VC10 = Cumulative Volume t10 = 10% of tracer mass (Sample Port) CDPH
VC10 Method for Determining the t10 of a Reactor • Instead of applying a short-circuiting factor (t10/T) to the reactor, the value t10 is determined daily based on the minimum time for VC10 to exit the reactor • t10 is the time associated with the V10. • Should have two tracer studies (winter/summer flows) • Only one test – use summer flow (conservative) CDPH
Tracer Study Began with – Flows 1, 2 & 3 (Scenario 2) Most Conservative Flow Regime Sample Pt. 1 3 Tracer Recorded delivered Volume of Water to t10 2 CDPH
Example: VC10 Method for Determining t10 of a Reactor *Normalizing VC10 allows operator to determine compliance. CDPH length of time required is max 1 hr. The normalized time may be less than 1 hr depending on test results. CDPH
VC10 Method for Determining the t10 of a Reactor • VC10 is normalized to 1 hour time frame • Maximum cumulative flow in 1 hour per day is determined • t10 is calculated based on equation developed for tracer studies for normalized VC10N CDPH
RememberTime is Proportional to Volume *The short-circuiting factor is not used to calculate t10 when the VC10 tracer test method is applied. CDPH
Step Dose Tracer Feed (continuous) Outlet Flow Rate (constant) Tank Level (~constant, start at 90% full) Tracer Sampling Pt (Tank Outlet) Monitoring (Tracer, Flow, Tank Volume) Test Length (3-5T) Results (BF= t10/T) Modified Step-Dose/VC10 Tracer Feed (continuous) Outlet Flow Rate (Variable) Tank Level (variable, start at lowest operating level) Tracer Sampling Pt (Tank Inlet, Tank Outlet or after Pressure Tank) Monitoring (Tracer, Flow*Time=Vol) Test Length (when >10% of concentration mass is achieved, <T) Results (VC10 ~ t10) Comparison of Tracer Test Methods –Step-Dose versus Modified Step-Dose/VC10 CDPH
Conclusion • Daily t10 can be determined for plants with non steady-state flows by using an alternative tracer test (VC10 Method) • Allows for appropriate chlorine dosages for actual operating condition versus high dosages based on applied baffling factor for non-operating conditions • VC10 Method can be used in place of EPA standard method of tracer testing CDPH
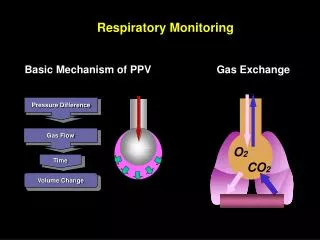
Analogy CDPH
Questions Guy Schott, P.E. California Department of Public Health Drinking Water Field Operations Branch guy.schott@cdph.ca.gov 707-576-2732 CDPH