Download

1 / 46
460 likes | 605 Vues
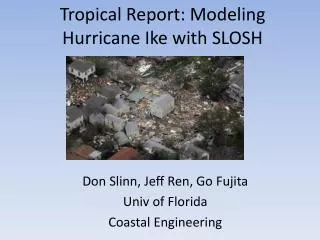
Tropical Report: Modeling Hurricane Ike with SLOSH. Don Slinn, Jeff Ren , Go Fujita Univ of Florida Coastal Engineering. Simulations. Basic Slosh wind model no waves Slosh winds + Garratt wind drag law Slosh winds + wave forces Slosh winds + wave forces + wave mass fluxes

E N D
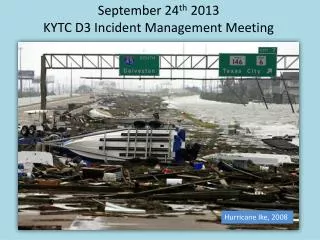
Tropical Report: Modeling Hurricane Ike with SLOSH Don Slinn, Jeff Ren, Go Fujita Univ of Florida Coastal Engineering
Simulations • Basic Slosh wind model no waves • Slosh winds + Garratt wind drag law • Slosh winds + wave forces • Slosh winds + wave forces + wave mass fluxes • OWI winds + Garratt wind drag law • OWI winds + wave forces • OWI winds + wave forces + wave mass fluxes • Slosh basic on Larger Basin • Slosh basic with lower bottom friction
Cd=(0.75+0.067U) Cap at 0.003 Stress=rho*Cd*U*(u,v)
Wave Mass Flux Depth Averaged Currents (Stokes Drift) Caused by Wave Crests higher than troughs (Starr, 1947)
INTRODUCTION▪▪▪ METHODOLOGY▪▪▪ RESULTS ▪▪▪ CONCLUSIONS Inclusion of Wave Forcing in SLOSH • Wave stresses • Mass flux transport
Wave Calibration plots 42035
Case 3 – Case 1 Case 4 – Case 1
MEOW of Low Bottom Friction Cf = 0.003
ETSS background • Resolution varies • Gulf of Mexico ~ 4km • East Coast ~ 9.4km • Alaska ~ 6.7km • West Coast ~ 6.5km • Each run has a 2 day initialization and a 4 day forecast period, for a total of 6 days • Results posted to the web • http://www.nws.noaa.gov/mdl/etsurge/ (text & hydrographs) • http://weather.noaa.gov/pub/SL.us008001/ST.expr/DF.gr2/DC.ndgd/GT.slosh/ (gridded data) • http://www.opc.ncep.noaa.gov/Loops/SURGE_GOM_EAST/SURGE_GOM_EAST_96_HR.shtml (gridded)
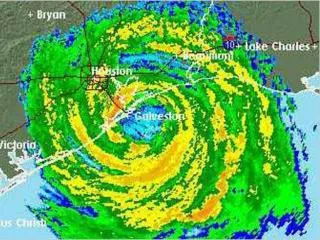
ETSS results for 3/4/2011 OPC’s website displaying gridded ETSS results MDL’s website displaying total water level station status map, based on ETSS output
Forecast Total Water Level for Hurricane Ike, Based on ETSS OPC’s website displaying gridded ETSS results for 3/4/11 Station total water level plot showing forecast for Ike storm surge event at Galveston, TX
Summary • Surge Low • 2 day simulation doesn’t catch forerunner • Small domain cant catch basin effects • Changing bottom friction increases surge by 1 m • Larger domain solution (not yet assessed) • Waves add 1 m in some locations • More data comparisons coming soon
Summary • Slosh model implemented for Ike with: • OWI Winds and / or Garratt Wind Drag • Coupled with Waves • Adjustments to Bottom Friction • Several details in development • Wind Stress reduction • Automatic Plotting Algorithms • Post processing and Data Comparison
Additional Work • Hurricane Rita (other storms easier for Slosh to give good estimates: Andrew, Charlie…) • Comparison to High water marks and measurements • Time series: cross shore locations • Wind stress reduction over land • Bottom Friction adjustments • (not quadratic law)