Download
1 / 33
340 likes | 457 Vues
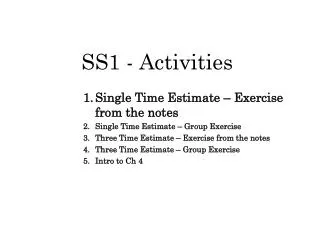
SS1 - Activities. Single Time Estimate – Exercise from the notes Single Time Estimate – Group Exercise Three Time Estimate – Exercise from the notes Three Time Estimate – Group Exercise Intro to Ch 4. Single Time Estimate – EXE from the notes. DEVELOPING THE NETWORK

E N D
SS1 - Activities • Single Time Estimate – Exercise from the notes • Single Time Estimate – Group Exercise • Three Time Estimate – Exercise from the notes • Three Time Estimate – Group Exercise • Intro to Ch 4
Single Time Estimate – EXE from the notes DEVELOPING THE NETWORK • All activities with no precedences, are placed at the left hand side. • Subsequent activities are added towards the right, with the arrows indicating the relationship • The network is presented in the notes. Best is to place one activity (node) at a time, with the arrows always pointing towards the right. Avoid this (arrow between and D and E): A 10 B 6 A 10 C 4 B 6 D 11 Avoid This A 10 C 4 E 3
.. .. .. ES, EF LS, LF B 6 D 11 F 18 A 10 G 15 .. 0, 10 .. C 4 E 3 .. .. Single Time Estimate – EXE from the notes CALCULATING THE COMPLETION TIME • Unless otherwise specified, we start at time = 0, ES = 0. First, we start with all activities with no precedences. In this case A. A starts at 0 and is completed at time 10. EF = ES + Activity Time. • We move towards the right, activity B. • There is only one arrow going into B, so it will start at the EF of the predecessor activity. The same for C. • Calculate the EF for B and C • We can’t start planning for E, until D is complete. 10, 16 .. .. .. ES, EF LS, LF B 6 D 11 F 18 A 10 G 15 .. 0, 10 .. C 4 E 3 10, 14 .. ..
10, 16 .. 16, 27 .. 27 .. ES, EF LS, LF B 6 D 11 F 18 A 10 G 15 .. 0, 10 .. C 4 E 3 10, 14 .. 27 .. Single Time Estimate – EXE from the notes • CALCULATING THE COMPLETION TIME • Now that D is planned (largest EF of its predecessors), we can plan E and F. When two or more arrows are going into an activity, pick the largest EF. For both F and E the ES is 27. • Just as for E and F, G has two predecessors. The largest EF is 45, so that is selected as its ES. • Finally, the largest EF is 60, so that is the Project’s Completion Time. 10, 16 .. 16, 27 .. 27, 45 .. ES, EF LS, LF B 6 D 11 F 18 A 10 G 15 45, 60 .. 0, 10 .. C 4 E 3 10, 14 .. 27, 30 ..
10, 16 .. 16, 27 .. 27, 45 .. ES, EF LS, LF B 6 D 11 F 18 A 10 G 15 45, 60 45, 60 0, 10 .. C 4 E 3 10, 14 .. 27, 30 .. Single Time Estimate – EXE from the notes • CALCULATING THE CRITICAL PATH • We start moving backwards by copying the LS = ES and LF =EF for the activity with the largest EF • As we move towards the left, when there is a single link going into a node, the LF will be the late start (LS) of the origin point. 10, 16 .. 16, 27 .. 27, 45 …., 45 ES, EF LS, LF B 6 D 11 F 18 A 10 G 15 45, 60 45, 60 0, 10 .. C 4 E 3 10, 14 .. 27, 30 …., 45
10, 16 .. 16, 27 .. 27, 45 27, 45 ES, EF LS, LF B 6 D 11 F 18 A 10 G 15 45, 60 45, 60 0, 10 .. C 4 E 3 10, 14 .. 27, 30 42, 45 Single Time Estimate – EXE from the notes • CALCULATING THE CRITICAL PATH • Calculate the LS by: LS = LF – Activity time • As we move towards the left, when there are 2 or more links going into a node, the LF will be the smallest LS of the alternative origin points. 10, 16 .. 16, 27 …., 27 27, 45 27, 45 ES, EF LS, LF B 6 D 11 F 18 A 10 G 15 45, 60 45, 60 0, 10 .. C 4 E 3 10, 14 .. 27, 30 42, 45
10, 16 10, 16 16, 27 16, 27 27, 45 27, 45 ES, EF LS, LF B 6 D 11 F 18 A 10 G 15 45, 60 45, 60 0, 10 0, 10 C 4 E 3 10, 14 23, 27 27, 30 42, 45 Single Time Estimate – EXE from the notes • CALCULATING THE CRITICAL PATH • Finish all LS and LF • Determine the Slack for each activity. Slack = LF – EF (or LS – ES). • SA = 0 • SB = 0 • SC = 13 • SD = 0 • SE = 15 • SF = 0 • SG = 0 All the activities with the slack of 0 represent a single path Therefore there is one critical path CP = A – B – D – F - G
SS1 - Activities • Single Time Estimate – Exercise from the notes • Single Time Estimate – Group Exercise • Three Time Estimate – Exercise from the notes • Three Time Estimate – Group Exercise • Intro to Ch 4
Single Time Estimate – GROUP EXE • DATA • Activity Time Prec • A 4 - • B 2 A • C 4 A • D 3 A • E 7 B, C • F 6 D, E • G 5 E • H 2 F, G • Try solving it before looking at the solution.
Single Time Estimate – GROUP EXE • DEVELOPING THE NETWORK • All activities with no precedences, are placed at the left hand side. • Subsequent activities are added towards the right, with the arrows indicating the relationship • Next one A 4 B 2 A 4 C 2 D 4 B 2 E 7 A 4 C 2 D 4
… … … B 2 E 7 G 5 A 4 C 4 H 2 0, 4 … F 6 … D 3 … ES, EF LS, LF … B 2 E 7 G 5 • DEVELOPING THE NETWORK • Final Network A 4 C 4 H 2 F 6 D 3 Single Time Estimate – GROUP EXE • CALCULATING THE COMPLETION TIME • For activity A, ES= 0 and EF = 4
4, 6 … … … B 2 E 7 G 5 A 4 C 4 H 2 0, 4 … 4, 8 … F 6 … D 3 … ES, EF LS, LF 4, 7 … Single Time Estimate – GROUP EXE • COMPLETION TIME • ES for B, C, and D is 4 as they have only one precedence • Calculate EF for all activities by ES + Activity time
4, 6 … … 8, 15 … • COMPLETION TIME • We can’t plan for F (we do not have the EF of E) • Let’s plan for E. There are 2 predecessors B and C, so the largest EF from B and C, which is 8. • Calculate EF for E. B 2 E 7 G 5 A 4 C 4 H 2 0, 4 … 4, 8 … F 6 … D 3 … Single Time Estimate – GROUP EXE ES, EF LS, LF 4, 7 … 8, 15 … E 7 • Now we plan for F. F has two predecessors, E and D • Largest EF from predecessors is 15 • For F, ES = 15 and EF = 21 F 6 D 3 15, 21 … 4, 7 …
Single Time Estimate – GROUP EXE 4, 6 … 15, 20 … 8, 15 … • COMPLETION TIME • Plan G and H • Project Completion time is 23. B 2 E 7 G 5 A 4 C 4 H 2 0, 4 … 4, 8 … F 6 21, 23 … D 3 15, 21 … ES, EF LS, LF 4, 7 …
Single Time Estimate – GROUP EXE 4, 6 … 15, 20 … 8, 15 … • CRITICAL PATH • Move ES and EF to LS and LF for activity with largest EF (completion time) B 2 E 7 G 5 A 4 C 4 H 2 0, 4 … 4, 8 … F 6 21, 23 21, 23 D 3 15, 21 … ES, EF LS, LF 4, 7 … • Moving towards the left. • Only one going into F, from activity H, so its LF is same as the LS of H • For F, • LS = LF – Activity Time H 2 F 6 21, 23 21, 23 F 6 15, 21 …, 21 15, 21 15, 21
Single Time Estimate – GROUP EXE 4, 6 … 15, 20 16, 21 8, 15 …, 15 • CRITICAL PATH • G and D can be planned in the same manner. • As we move left, there are 2 going into E, activities F and G. The smallest LS is 15. B 2 E 7 G 5 A 4 C 4 H 2 0, 4 … 4, 8 … F 6 21, 23 21, 23 D 3 15, 21 15, 21 ES, EF LS, LF 4, 7 12, 15 4, 6 6, 8 8, 15 8, 15 • Calculate LS for activity E • As we move left, only one activity going into B and C, activity E with LS of 8, therefore LF = 8 for both B and C. B 2 E 7 C 4 4, 8 4, 8
Single Time Estimate – GROUP EXE 4, 6 6, 8 15, 20 16, 21 8, 15 8, 15 • CRITICAL PATH • Finished with all calculations B 2 E 7 G 5 A 4 C 4 H 2 0, 4 0, 4 4, 8 4, 8 F 6 21, 23 21, 23 D 3 15, 21 15, 21 ES, EF LS, LF 4, 7 12, 15 • Determine the Slack for each activity. Slack = LF – EF (or LS – ES). • SA = 0 • SB = 2 • SC = 0 • SD = 8 • SE = 0 • SF = 0 • SG = 1 • SH = 0 All the activities with the slack of 0 represent a single path Therefore there is one critical path CP = A – C – E – F - H
SS1 - Activities • Single Time Estimate – Exercise from the notes • Single Time Estimate – Group Exercise • Three Time Estimate – Exercise from the notes • Three Time Estimate – Group Exercise • Intro to Ch 4
Three Time Estimate – EXE from the Notes • INTRODUCTION • Single Time PM procedures are used when there is a good understanding of the activity times (we are confident in our time estimate). • Three time estimates PM procedures are used when activities are new or problematic. For example, activities dealing with many people may have lots of variability. • The idea here is that each activity has 3 times estimates, • - Optimistic –fastest we can get the activity completed. Best case scenario Kj • - Most likely – reasonable amount of time (largest probability) Lj • - Pessimistic – worst case scenario Nj • For example, writing customer requirements for software X. In the best case, 2 weeks, most likely 5 weeks, and in the worst case, 11 weeks. • The first step of the process is to generate Mj. Mj is the mean time for each activity. • Mj = (Kj + 4 * Lj + Nj ) / 6. Note the 4 and 6 are constants and do not change. • For the above example Mj = (2 weeks + 4 * 5 weeks + 11 weeks) / 6 = 5.5 weeks
Three Time Estimate – EXE from the Notes PROCESS - Calculate Mj for all activities. - Note Table 3.3 of the notes has all the Mj’s already calculated. - Draw the network, calculate the completion time, and the critical path as previously described. See Figure 3.5 from the notes. - Note in this case there are 2 activities with no predecessors, P and Q. Both go in the left hand side of the paper. Then the process is the same. Having more than one start activity is common, multiple activities can be started simultaneously if they are independent. For example researching on the library and researching on the web. P 5.2 R 6.0 Q 7.0
Three Time Estimate – EXE from the Notes COMMENTS - This process allows us to understand the probabilities of completing the project for some range of times. - In terms of managerial importance, we can find out what is the probability we will finish the project by an important time. For a toy manufacturer, what is the probability of delivering all toy shipments by Nov 10. If we are not at 90% or more, we may need to get some help. - Clearly, PM focuses on the Critical Path and, similarly, these probabilities are “based” on the CP. PROCESS Calculate the variance ( s2j ) for each activity in the CP. If there is more than one CP, calculate the variance for all act ivies in each CP. s2j = [ ( Nj – Kj ) / 6 ] 2 The variance of the activity in the previous page: [ (11 – 2) / 6] 2 = 2.25
Three Time Estimate – EXE from the Notes NOTES EXAMPLE The CP for the example in the notes is: Q-R-T-W-X. Completion Time = 42.9 Table 3.3 has all the variances. The idea is that the project behaves like Normal Variable, with mean 42.9 - We now add, those variance to determine the variance of the Critical Path s2cp = Sum of the variance for all activities in the CP for the example in the notes 2.78 + 0.44 + 11.11 + 2.78 + 0.25 = 17.36 - TWO corrections to the Notes. > Page 4, step 4a. Instead of a box, it should be a square root symbol. > Table 3.1 is now Appendix A at the end of the Notes. 42.9
Three Time Estimate – EXE from the Notes NOTES EXAMPLE We can now answer probability questions. Let’s look at Completing the project in 45 days or less? P(X<=45) Graph to the right demonstrates the idea. So we first calculate the Z value U is the time we are looking for. Z = (U – CT) / square root of (17.36) = (45 – 42.9)/ 4.17 = 2.1/4.17 = 0.50 (round to 2 decimals). Look at the Appendix at the end of the Course Notes. The left side of each column has the Z value. Get the closest Z in the table and look at the probability to the right. The probability at Z = 0.5 is 0.758 or 75.8% What if we want to know the probability the project will take 45 days or more? P(X>45)? Note that P(X>45) = 1 – P(X<=45) and Appendix A only has P(X<=U), So the answer is 1 – 75.8% = 24.2% 42.9 45
52 40 52 Three Time Estimate – EXE from the Notes NOTES EXAMPLE Finally, probability for time intervals. Between 40 and 52 days. P(40 < X <=52)? We need to find two probability values. One for 40 and one for 52. P(40 < X <=52) = P(X<=52) – P(X<=40). See the graphs below to get the idea. minus equals P(X<=52) P(X<=40) 40 P(40 < X <=52) All calculations are in the notes
SS1 - Activities • Single Time Estimate – Exercise from the notes • Single Time Estimate – Group Exercise • Three Time Estimate – Exercise from the notes • Three Time Estimate – Group Exercise • Intro to Ch 4
Three Time Estimate – GROUP EXE • DATA • Activity K L N Prec • A 1 3 5 - • B 1 2 3 A • C 1 2 3 A • D 2 3 4 B, C • E 3 4 11 B, C • F 3 4 5 C • G 1 4 6 F • H 2 4 5 E, D • Try solving it before looking at the solution.
Calculating the Mj’s • Activity K L N Mj Prec • A 1 3 5 3 - • B 1 2 3 2 A • C 1 2 3 2 A • D 2 3 4 3 B, C • E 3 4 11 5 B, C • F 3 4 5 4 C • G 1 4 6 3.83 F • H 2 4 5 3.83 E, D • The network and CT. CT = 13.83 3, 5 … Three Time Estimate – GROUP EXE 5, 8 … B 2 D 3 10, 13.83 … A 3 H 3.83 E 5 0, 3 … C 2 5, 10 … 3, 5 … G 3.83 F 4 9, 12.83 … 5, 9 …
Note we have multiple end activities. Having multiple ending activities is common (multiple project outputs that are independent of each other). Given there are two activities at the end, we use as LF, the largest of the 2. 3, 5 3, 5 5, 8 7, 10 B 2 D 3 10, 13.83 10, 13.83 A 3 H 3.83 E 5 0, 3 0, 3 C 2 Three Time Estimate – GROUP EXE 5, 10 5, 10 3, 5 3, 5 G 3.83 F 4 9, 12.83 10, 13.83 Slacks SA = 0 SB = 0 SC = 0 SD = 2 SE = 0 SF = 1 SG = 1 SH = 0 5, 9 6, 10 Correction In this case, the activities with the slack of 0 represent two paths Therefore there are 2 critical path CP = A – C – E – H and A – B – E - H
Three Time Estimate – GROUP EXE PROCESS - Need to calculate the variances for all activities in both CP. - The variance are: A 0.44 B 0.11 C 0.11 E 1.78 H 0.25 s2ABEH = 0.44 + 0.11 + 1.78 + 0.25 = 2.58 s2ACEH = 0.44 + 0.11 + 1.78 + 0.25 = 2.58 In cases where the variances are different, pick the largest.
Three Time Estimate – GROUP EXE PROCESS So we can now calculate probabilities. - What about completing the project in less than 20 days? P(X<=20) Z = (20 – 13.83) / square root (2.58) = 6.17 / 1.61 = 3.84. The closest Z value is 3.85. P(Z) = 0.99994, = 99.9% So we are pretty sure we will be done before time 20. - What about taking 12 days or more? P( X > 12) P( X > 12) = 1 – P(X >= 12) Z = (12 – 13.83) / square root (2.58) = -1.83/1.61 = - 1.14. The closest Z is –1.15, with a probability of 12.5%. But remember this probability id for P(X <= 12), not what we are looking for. To get our answer: P( X > 12) = 1 – P(X >= 12) = 1 – 12.5% = 87.5%. - Finally, what about between 12 and 15? P(12 < X <=15) P(12 < X <=15) = P( X <=15) – P(X<=12) = P( X <=15) – 12.5% Calculate P( X <=15) Z = (15 – 13.83) / square root (2.58) = 1.17 / 1.61 = 0.73. The closest Z is 0.75, with a probability of 77.3% So the probability is: 77.3% - 12.5% = 64.8%
SS1 - Activities • Single Time Estimate – Exercise from the notes • Single Time Estimate – Group Exercise • Three Time Estimate – Exercise from the notes • Three Time Estimate – Group Exercise • Intro to Ch 4
Intro to Forecasting • Forecasting is a vital activity as is will directly affect multiple operations functions. Forecasts will drive the inventories we will stock, the capacity we will keep, products we will design,… • Forecasting is difficult and 99.99999% of the cases wrong. Objective is to minimize how wrong we are. Complex and simple math model, expert systems, and others are used to predict the future. • For example, we are now in a recession and most forecasts predict the slow economy will continue. This is translated into company forecasts for their products. Ford recently announced the shutting down of assembly lines and 35,000 layoffs. This is capacity reduction related to a forecast that predicts slow sales and therefore the need to reduce capacity. These reductions have an effect downstream and it affects local Mfg like Delphi and Yazaki who make car components, and further to those that supply Delphi and Yazaki. • Section 4.1. Product demand is made of three components, trend, season, and random. An example was given in class, forecasting for a gas station. They used data from the previous weeks plus data from last year. Factors like seasons (summer is driving season) play a role in the demand for gasoline, and therefore how much they needed to buy. Price also is a factor in how much the will sell. Note that errors in both direction cause problems, if we plan for less than demand, we will loose business. I we plan for more than demand, we will carry extra inventories (a cost). • Seasons drive capacity plans for travel, toy production, ski production, clothing, … • Most other info is on the notes. Check out the Delphi method in section 4.2
Thanks for your time.Hope this helps.Visit me during office hours if you have any questions (or by appointment)