Download
1 / 28
280 likes | 423 Vues
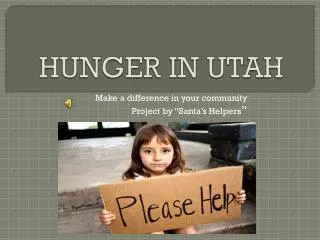
Hunger In America. In 2008. 49.1 million Americans lack the means to regularly put enough nutritious food on the table . They are food insecure and struggle with hunger. In 2008. 32.4 million adults and 16.7 million children lived in food insecure households.

E N D
In 2008 49.1 million Americans lack the means to regularly put enough nutritious food on the table . They are food insecure and struggle with hunger.
In 2008 • 32.4 million adults and 16.7 million children lived in food insecure households. • 14.6% percent of households (17.1 million households) were food insecure, an increase from 11.1 percent (13.0 million households) in 2007.
What is “food insecure”? • Families struggling with hunger experience three or more symptoms of food insecurity during seven months of the year, on average. • Symptoms of food insecurity include running out of food without money to buy more, cutting portion sizes or skipping meals, and not feeding children in the family because there isn’t money for food.
High Food Security: These are households that did not answer ‘yes’ to any of the food insecurity questions. • Marginal Food Security: This term captures families that answered ‘yes’ to one or two of the food security questions, meaning they have has some difficulties with securing enough food.
Low Food Security: People that fall into this category have had to make changes in the quality or the quantity of their food in order to deal with a limited budget. • Very Low Food Security: People that fall into this category have struggled with having enough food for the household, including cutting
Food insecurity exists in: • 14.6% of all U.S. households • 42.2% of all households at or below the poverty line • 37.2% of all single-mom households
Who are food insecure families? • 83.6% live in major metropolitan areas • 67.7% live above the poverty line • 52.1 % are white • 48.7% (8.3 million) have kids under 18 There are 17.1 million food insecure families in the United States.
Food insecurity affects nearly 17 million children in America. • 34% more than last year • 48.7% live in married-couple families • 41.9% live in single-mom families • 41.2% live at or below the poverty line • 40.3% live in the South • 35.5% live in cities outside of major metro areas
Households Likely to Experience Food Insecurity • households with children (21.0 percent). • households with children headed by single women (37.2 percent) or single men (27.6 percent). • households with incomes below the poverty line (42.2 percent). • Black non-Hispanic households (25.7 percent) and Hispanic households (26.9 percent). • In 2008, 8.1 percent of households with seniors (2.3 million households).
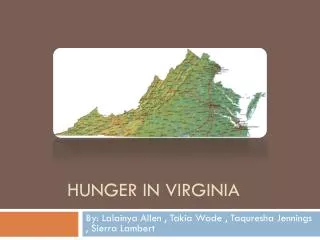
ACCORDING TO THE USDA HOUSEHOLD FOOD SECURITY IN THE UNITED STATES 2008 REPORT, TEN STATES EXHIBITED STATISTICALLY SIGNIFICANT HIGHER HOUSEHOLD FOOD INSECURITY RATES THAN THE NATIONAL AVERAGE (12.2%): 1. MISSISSIPPI 17.4% 2. TEXAS 16.3% 3. ARKANSAS 15.9% 4. GEORGIA 14.2% 5. NEW MEXICO 14.1% 6. MISSOURI 14.0% 7. OKLAHOMA 14.0% 8. KANSAS 13.8% 9. MAINE 13.7% 10. NORTH CAROLINA 13.7%
8 states plus the District of Columbia have 20 percent or more of children under 18 living in food insecure households; • Texas (22.1 percent) and Mississippi (21.5 percent) have the highest rates of children in households without consistent access to food.
POVERTY STATISTICS In 2008: • 39.8 million people, (13.2 percent) • 8.1 (10.3% percent) million families, • 22.1 million (11.7 percent) people aged 18-64, • 14 million (19 percent) children under the age of 18, • 3.6 million (9.7 percent) seniors 65 and older were living in poverty. 744,000 more children live in poverty now than a year ago.
$21,834 annual income is the poverty threshold for a family of four, or $419.89 per week.
One in eight Americans (37 million people, including 14 million children and three million seniors) don't get enough to eat.
POVERTY FOR CHILDREN UNDER 18 REMAINS HIGHER THAN THOSE AGED 18 TO 64 AND FOR THOSE AGED 65 AND OVER. 14 million or approximately 19% of children in the U.S. live in poverty.
A report from the Food Research and Action Center found that nearly one in five in the US -- 18.5 percent -- report having gone hungry in the past year(2009), up from 16.3 percent at the start of 2008.
Households with children were even likelier to experience hunger, with nearly a quarter reporting hunger in the past year.
Food Banks and Soup Kitchens IN 2008, 4.1 PERCENT OF ALL U.S. HOUSEHOLDS (4.8 MILLION HOUSEHOLDS) ACCESSED EMERGENCY FOOD FROM A FOOD PANTRY ONE OR MORE TIMES.
About 5.7 million people (or 1 in 50) get emergency food aid from the system in any given week. This is an increase of 27% since 2005.
The study, Hunger in America 2010, found that 37 million people, or roughly one in eight US residents, received food aid in 2009. That's a 46% jump from a similar survey carried out in 2006.
The number of Americans in need of food aid has: • jumped 46 percent in three years, • including a 50 percent jump in the number of children needing food assistance, and a • 64 percent increase in hunger in senior citizens' homes.
Who Goes to Food Banks? • 38% are children under 18, compared to 36% in 2005; • 8% are elderly, down from 10% in 2005; • about 40% are white; 34% black; 20% Hispanic; and the remainder from other racial groups; • 36% of households include at least one employed adult, the same as in 2005; • 71% of households have incomes below the federal poverty level during the month preceding the survey, up from 69% in 2005; • median monthly household income decreased by 7% from $825 to $770 in 2009 dollars; and • 10% are homeless, compared to 12% in 2005.
Many clients report having to choose between food and other necessities: • 46% between food and paying for utilities, including heating oil, up from 42% in 2005; • 39% between food and paying rent or mortgages, compared to 35% in 2005; • 34% between food and medical care, including drugs, up from 32% in 2005; • 35% between food and transportation; and • 36% between food and gasoline for a car.
Despite the growing need, 70 percent of emergency food centers face threats to their survival .
Homeless in Montgomery County • In 2009, 445 individuals were served by the adult homeless center at Norristown State Hospital. • The unofficial total tabulated in February this year was about 749. • About 40 people are added to the homeless roster every week.
St. John’s Soup Kitchen • Serves over 100 meals twice a week. • Survives completely on donations. • Is staffed by volunteers only.