Hunger
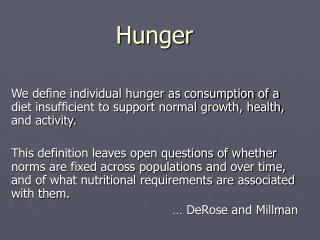
Hunger. We define individual hunger as consumption of a diet insufficient to support normal growth, health, and activity. This definition leaves open questions of whether norms are fixed across populations and over time, and of what nutritional requirements are associated with them.

Hunger
E N D
Presentation Transcript
Hunger We define individual hunger as consumption of a diet insufficient to support normal growth, health, and activity. This definition leaves open questions of whether norms are fixed across populations and over time, and of what nutritional requirements are associated with them. … DeRose and Millman
Analytical Problems Measurement Trends and Patterns Explanation Intervention Thematic Frames Political Economy Health and Nutrition Social Conditions Hunger
Topics in Political Economy • Food Shortage: area and population. • Food Poverty: household. • Food Deprivation: individual • Famine and Calamity • Episodic, Seasonal, Chronic Hunger • Provisioning Institutions: Markets, States, NGOs, development agencies • Interventions: Programs and policies, Structural Adjustment
NUTRITION Protein-energy malnutrition Micronutrient Deficiency Iron Iodine Vitamin A Disease Interactions Environmental Interactions HEALTH Birth Growth Development Mortality Morbidity Capability Topics in
Social Conditions • Inequality: • Nationality, Class, Race Gender, Ethnicity • Girl, Woman, Mother • Fetus, Newborn, Infant, Child • Minority, Discrimination, Disability • Dislocation, Displacement, War
Nutrition and Health Some basic issues
Protein-energy malnutrition (PEM) • Combined insufficiency of calories and protein • the most widespread form of hunger. • kilocalories daily requirement collapses protein/calories into single calories measure • Food-based poverty lines based on PEM threshold
Food Requirements and Poverty Lines In Bangladesh • DCI – Direct Calorie Intake – poverty line • 1,805 kcal/day for the hardcore poor • 2,122 kcal/day for the absolute poor • FEI – Food Energy Intake – poverty line • monthly expenditure (income) required for calories = food/energy requirement at 2,122 kilocalories/day in rural areas and 2,112 kcal/day in urban areas. • 1995 FEI poverty line = Tk 419.70 per month in rural areas and • and Tk 707.8 per month in urban areas • CBN – Cost of Basic needs – poverty line • FEI poverty line PLUS non-food poverty line. • Non-food poverty line is set at two levels (upper and lower) for each of 14 regions. • “Absolute poor” are people below the upper line, and “hardcore poor” are people below the lower line. • In 1995, the upper lines ranged from Tk563/mo in rural areas of Khulna, Jessore, and Kushtia, to Tk 950 per month in Dhaka (standard metropolitan area).
1985 WHO Minimum daily caloric requirements by sector and gender Urban Rural Age categories Male Female Male Female 0 to 1 year 820 820 820 820 >1 to 2 years 1,150 1,150 1,150 1,150 >2 to 3 years 1,350 1,350 1,350 1,350 >3 to 5 years 1,550 1,550 1,550 1,550 >5 to 7 years 1,850 1,750 1,850 1,750 >7 to 10 years 2,100 1,800 2,100 1,800 >10 to 12 years 2,200 1,950 2,200 1,950 >12 to 14 years 2,400 2,100 2,400 2,100 >14 to 16 years 2,600 2,150 2,600 2,150 >16 to 18 years 2,850 2,150 2,850 2,150 >18 to 30 years 3,150 2,500 3,500 2,750 >30 to 60 years 3,050 2,450 3,400 2,750 >60 years 2,600 2,200 2,850 2,450 Source: Caloric requirements are from WHO (1985, Tables 42 to 49). Notes: Requirements used are for men weighing 70 kilograms and for women weighing 60 kilograms. Urban individuals are assumed to need 1.8 times the basal metabolic rate (BMR), while rural individuals are assumed to need 2.0 times the average BMR. Children under one year of age are assigned the average caloric need of children either 3–6, 6–9, or 9–12 months old.
LBW, Wasting, Stunting, obesity BMI MUAC obstetric risk, inf and mat mortal, child development • http://www.ncbi.nlm.nih.gov/entrez/query.fcgi?cmd=Retrieve&db=PubMed&list_uids=12259584&dopt=Abstract • Child development indicators and public health. • Measurements of physical development - height, weight, cranial circumference, and arm measurements - are called better predictors of nutritional and developmental status than mortality and morbidity figures. • Low birth weight is directly associated with poor maternal nutrition while poor development is associated with malnutrition or undernutrition of the child. • There is a critical period from Month 6 of pregnancy to about Year 2 of life when brain cells develop; poor nutrition during this critical period will result in permanent lack of mental capacity. • Studies in Africa, Latin America, and Asia all point out the extremely damaging effects of poor nutrition during this critical period. Malnutrition or undernutrition occuring later in life can be reversed with proper feeding. • The problems of obesity are as serious as those of malnutrition. The baby who collects a surplus of fat cells under the skin during the 1st year of life is likely to be overweight most of the rest of his life. Lowering age of maturation is another indication of improving nutrition. This phenomenon has been observed in all industrialized countries and is the basis of much of the adolescent PROBLEM. • Child development indicators should be used to point out areas of a country or sectors of the population in need of additional health or nutritional aid.
Wasting and Stunting • PEM reduces growth in children • Energy expenditure in excess of consumption leads to metabolizing nutrition reserves in the form of stored body fat. • Lean body mass in the form of muscle and even organ tissue will also be consumed if PEM persists. • Weight loss accompanies the initial stages of inadequate energy intake but, if prolonged, is followed by wasting, called in its severe clinical form, marasmus. • In children, PEM delays or permanently stunts growth and increases morbidity and mortality.
Measuring Healthy Growth • Body Mass Index (BMI) • BMI is a measure that adjusts bodyweight for height. It is calculated as weight in kilograms divided by height in meters squared. Overweight for children and adolescents is defined as BMI at or above the sex-and age-specific 95th percentile BMI cut points from the 2000 CDC Growth Charts. Healthy weight for adults is defined as a BMI of 18.5 to less than 25; overweight, as greater than or equal to a BMI of 25; and obesity, as greater than or equal to a BMI of 30. • http://www.cdc.gov/nccdphp/dnpa/bmi/calc-bmi.htm • BMIWeight Status: • < Below 18.5 = Underweight. • 18.5 – 24.9 Normal. • 25.0 – 29.9 Overweight • 30.0 and AboveObese • lbw in US < 5 lbs 8 oz or 2500 g • very low birth weight (VLBW) <1500 grams • The following charts are from NATIONAL CENTER FOR HEALTH STATISTICS http://www.cdc.gov/nchs/
Child Morbidity and Mortality • Health statistics tend to ascribe child deaths to malnutrition or infectious disease, but causes tend to be interlinked. • Using case studies from poor countries, David Pelletier concluded that malnutrition contributed to 56 per cent of all child deaths, owing to its interaction with infectious disease. • About 83 per cent of these malnutrition-related deaths were attributed to mild-to-moderate malnutrition. • Elevated morbidity and mortality are also associated with micronutrient malnutrition, especially vitamin A and iron deficiencies.
Disease Interactions • The relationship between malnutrition and infection is reciprocal and synergistic. • Disease leads to a deterioration in nutritional status at the same time that malnutrition increases susceptibility to disease. • Effects of disease on nutritional status involve shifts in the types and quantities of foods consumed (whether due to custom or loss of appetite) and to decreased absorption and diarrhea. • Parasitic organisms, as in malaria or schistosomiasis, or intestinal worms, divert nutrients for their own use. • Energy, protein, and micronutrient needs are elevated in order to fight off infection. • Immune function deteriorates with extreme PEM; evidence is more mixed as to possible increases in susceptibility to infection with mild to moderate malnutrition.
water sewage pollution parasites diarrhea malnutrition dehydration sickness(WDR2000/1)
Iron Deficiency • Iron deficiency is believed to be the most common micronutrient deficiency in the world today. • It appears most common in South Asia and Africa. • About 22 per cent of the world's population is thought to have deficiencies of iron extreme enough to cause anemia. • Iron deficiency is especially common among reproductive-aged women, whose requirements are higher than those of others.
Anemia in Bangladesh Gender and Ethnic Inequality UNICEF/BRAC/BBS 2004 study of anemia prevalence: urban adolescent girls = 29% urban adolescent boys = 17% (lowest of all groups) Chittagong Hill Tracts adolescent boys = 40% CHT adolescent girls = 50%
Iodine Deficiency Effects are physical and mental • Cretinism results from severe deficiency during gestation. It is irreversible and includes "profound mental deficiency.” • Goitre, a pronounced swelling of the thyroid gland, may develop at any time. • High rates of milder mental impairment have been found in areas where goitre and cretinism are common. • UNICEF estimated that 30 per cent of the world's population is at risk of mental and physical impairment due to iodine deficiency, though less than half that number manifest visible signs of goitre or cretinism. • According to Stanbury (1991), "Iodine deficiency is the most frequent cause of preventable mental retardation today."
Iodine Deficiency • The most severe problem is restricted to areas with iodine-poor soils, typically mountainous, glaciated, and/or subject to heavy rainfall or flooding. • Milder forms may occur in these and other regions (including European countries) where intakes of iodine-adequate foods are low. • The greatest concentrations of population in areas of iodine deficiency are in South-East Asia, and pockets of Africa and Latin America.
Vitamin A Deficiency • Deficiency of vitamin A was estimated to affect some 231 million children in 1994, over half of them in just three countries - Bangladesh, India, and Indonesia. • Vitamin A comes from a wide range of vegetable and animal sources but children, especially, may lack adequate access, owing to culture or economic restrictions in diet. • Vitamin A deficiency is a major cause of blindness, mainly in childhood. • Many of those blinded die shortly thereafter. • It has been linked to increased vulnerability to infectious disease, with some studies claiming dramatic reduction in child mortality when vitamin A supplementation is provided to all children in areas in which even a few show the visible signs of vitamin A deficiency
Maternal and Child Malnutrition • Malnutrition of pregnant women may lead to serious problems for children. • Most dramatic is cretinism resulting from severe maternal iodine deficiency • More commonly, children born to chronically undernourished women are likely to be small at birth. • Low birth weight is associated with increased risk of mortality and with a range of health and developmental problems.
JAMA MUAC BMI (see link syllabus) • MUAC measurement was easier to perform on severely malnourished adults than BMI assessment. • For MUAC, the patient could be standing, sitting, or, in extreme cases, lying. For BMI, patients were required to stand. Measuring BMI requires a height board, weighing scales, and mathematical calculations; to measure MUAC, only a tape measure is required. • A correlation between measurements of MUAC and BMI was demonstrated (r=0.88; 95% confidence interval, 0.82-0.92 P<.001). The proportions of the population and the actual individuals identified as malnourished by the 2 indicators were similar. • CONCLUSIONS: The MUAC measurement reflects adult nutritional status as defined by BMI. During famine, MUAC may be better suited to screening admissions to adult feeding centers than BMI. Studies to assess the capacity of MUAC cutoffs to predict mortality in severe adult malnutrition are needed.
Risk factors for stunting and wasting at age six, twelve and twenty-four months for squatter children of Karachi, Pakistan.Fikree FF, Rahbar MH, Berendes HW. • At two years the proportion of stunting and wasting was 41.8% and 10.6% respectively. • Intrauterine growth retarded children had a higher risk of stunting and wasting at all reference ages as compared to children who were appropriate for gestational age. • In the logistic regression models, intrauterine growth retardation was the only significant risk factor that remained in all models at each reference age. • CONCLUSION: The consistent association of IUGR for stunting and wasting adds to the growing body of evidence that by improving maternal health we will ultimately break the vicious cycle of malnourishment and improve the health and well-being of future generations.
Malnutrition among girls can affect their babies later in life • Undernutrition in childhood can cause growth stunting and influence the size of the child a woman can bear later in life. • Maternal pelvic size is a strong determinant of neonatal survival and universally correlated with height in populations. • The proportions of low birth-weight infants are much higher in populations identified as poorly nourished according to adult anthropometric indicators, ranging from lows of 4-6% in affluent countries to highs of 25% or more in Pakistan, India, Bangladesh, and Laos.
Food Shortage. Food Supply • Is there enough food for population in given area? • “Global” supply scenario is aggregation of national scenarios: • gross food supply (total production) • net food stocks (after waste, import export, animal feed, etc)
How do markets influence food shortage? Discuss (from Uvin) • p.4. “A low food self-sufficiency ratio is not an indicator of hunger within countries, nor is a high food self-sufficiency ratio a guarantee of the absence of hunger.” • “The smaller and poor a country, the more pronounced will be its vulnerability to … fluctuations [in world markets], and the less it will be capable of influencing them.” • “To the extent that declining food self-sufficiency ratios reflect declining entitlements to [farmers and agricultural laborers] declining rations can coincide with icnreasing hunger.”
Countries with DES below requirement, 1988-90(Uvin table 1.6), and FAO 1992 est of malunourished(table 1.10),