Lesson 09 Facilities Layout
This lesson explores the critical aspects of facilities layout, emphasizing the configuration of departments, work centers, and equipment to enhance the movement of products and customers through the system. The importance of layout decisions is underscored, highlighting their impact on operational efficiency, costs, and long-term commitments. Various layout types, including product, process, and cellular layouts, are examined alongside their advantages and disadvantages. Additionally, we discuss strategies to reduce waste and improve safety, communication, and adaptability to changing conditions in production environments.

Lesson 09 Facilities Layout
E N D
Presentation Transcript
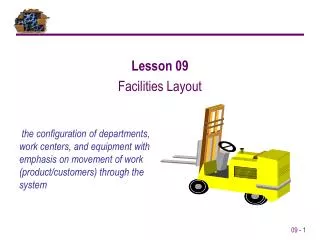
Lesson 09 Facilities Layout the configuration of departments, work centers, and equipment with emphasis on movement of work (product/customers) through the system
Production Process Work center Work center Work center Work center Storage Storage Storage Receiving Shipping Facilities Layout
The Need For Layout Decisions Layout decisions are important for 3 basic reasons: . Require substantial investments of money and effort . Involve long term commitments which make mistakes difficult to overcome . They have significant impact on cost and efficiency of short term operations
The Need For Layout Decisions Improve inefficient operations (e.g. bottlenecks)Accidents or safety hazardsMinimize material handling costs Utilize space efficiently Utilize labor efficiently Incorporate security measures Morale problems - facilitate communication and interaction between workers, between workers and their supervisors, or between workers and customers
The Need For Layout Decisions Reduce manufacturing cycle time or customer service time Eliminate waste or redundant movement Promote product and service quality Encourage proper maintenance activities Provide a visual control of operations or activities Facilitate the entry, exit, and placement of material, products, or people Provide flexibility to adapt to changing conditions . Changes in volume or mix of outputs. Changes in methods or equipment. Changes in design of products/services . Introduction of new products/services . Changes in environmental or other legal requirements
Raw materials Finished item In Workers Material Labor Material Labor Material Labor Material Labor Out Basic Layout Types ProductLayouts - uses standardized processing operations to achieve smooth, rapid, high-volume flow .Production/AssemblyLine – fixed sequence of production/assembly .U-Shaped Layouts – better utilization of labor
Product Layout Advantages/Disadvantages Advantages . High rate of output . Low unit cost – equipment cost spread over many units . Labor specialization reduces training costs & time . High utilization of labor and equipment . Accounting, purchasing & inventory control are more routine Disadvantages . Repetitive jobs with little advancement - morale issues. Poorly skilled workers may have little interest in quality . Inflexible system sometimes susceptible to shutdowns . Quick repairs require spare-parts inventories & maintenance
Milling Assembly Grinding Plating Drilling Basic Layout Types ProcessLayouts – can handle varied processing requirements and usually has departments or other functional groupings where similar kinds of activities are performed . Equipment is laid out by type rather than manufacturing sequence . Products/Services move through the system dictated by technical considerations rather than a specified sequence of operations (e.g. hospitals, banks, machine shops, grocery stores, fast food)
Process Layout Advantages/Disadvantages Advantages . Can handle a variety of processing requirements . Not particularly vulnerable to equipment failures . Generalized equipment is often less costly to maintain . Individual incentive systems are more successful Disadvantages . In process inventories can be much higher. Routing and scheduling are continual challenges . Equipment utilization rates are much lower - higher unit cost . Material handling is slow & inefficient and more costly . Higher supervision costs
Basic Layout Types Fixed PositionLayouts – product or project remains stationary, and workers, materials, and equipment are moved as needed CombinationLayouts - can include combinations of product, process and fixed position layouts
Lathe Mill Drill Heat Grind Grind Heat Lathe Mill Drill Product/ProcessLayouts – can be converted to more efficient layouts by grouping equipment to do a fixed sequence of processing steps Heat Mill Drill Grind Assembly Heat Lathe Mill Grind Grind Mill Drill Basic Layout Types CellularLayouts – groups machines into cells that process products that have similar requirements
Group Technology One worker – several machines
Cell 1 Assembly area D G M L L Cell 2 A A Receiving H G L M M L D Cell 3 Shipping Cellular Layout
Basic Layout Types Service Layouts – deals with locating departments so that the service they provide is the most efficient . Warehouse & Storage layouts . Retail layouts . Office layouts
How many assignment possibilities are there for these departments and locations? Dry Groceries Meats Frozen Foods Check Out Bread Vegetables Designing Layouts Designing layouts to meet the many needs/objectives of layout decisions is a very difficult task. Because of the many variables and the number of possible options it is often impossible to do without developing heuristic (intuitive) rules. 6! = 6*5*4*3*2*1 = 720 possibilities
.1 min .7 min .5 min .2 min 1.0 min Designing Layouts Precedencediagrams are essential in designing layouts. They show the elemental tasks, times and sequencing of steps in a process. .1 min 1.0 min .7 min .5 min .2 min
Idle time 2 min Idle time 2 min Designing Layouts Precedencediagrams identify bottlenecks. Bottlenecks are processes which can not keep pace with their preceding suppliers, thus creating idle time and inefficiency. Bottleneck Scrubbing 2 min Rinsing 4 min Drying 2 min The bottleneck in this process can easily be eliminated by building a new rinsing station (paralleltask); however the decision must be based on financial considerations! Therefore, it becomes the operations managers responsibility to evaluate alternative solutions (e.g. Can the tasks be assigned in another way to achieve better throughput?).
30/hr. 30/hr. 30/hr. 30/hr. 1 min. 1 min. 2 min. 1 min. Bottleneck 1 min. 30/hr. 30/hr. 60/hr. 60/hr. 1 min. 1 min. 1 min. 30/hr. 30/hr. 1 min. Parallel Workstations Designing Layouts Parallel tasks are very helpful in eliminating bottlenecks.
Designing Layouts In the previous example we say that the tasks could not be assigned differently to achieve better throughput; however there are many instances where this is not the case. LineBalancing is a procedure which can be used by the operations manager to assign tasks to workstations so that a more even (smoother) work flow can be achieved. Difficulties in Line Balancing . It may not be feasible to bundle tasks (differences in equipment requirements or non-compatible activities) .Differences in task lengths can not always be overcome by grouping tasks . A required technological sequence may prohibit desired task groupings
.1 min .1 min .1 min .7 min .7 min .7 min .5 min .5 min .5 min .2 min .2 min .2 min 1.0 min 1.0 min 1.0 min We can assign all of the tasks to 1 Workstation We can assign some of the tasks to 1 Workstation and some to another Assigning Tasks To Workstations Consider the following 5 tasks. How many workstations are possible? There are many possibilities! So what do we do?
Assigning Tasks To Workstations Cycle Time (CT) is the maximum time allowed at each workstation to complete its set of tasks on a unit. It establishes the outputcapacity. As a general rule, Cycle Time is determined by DesiredOutputCapacity (D). Suppose a line operates 8 hours per day (480 minutes) and the Desired Output Capacity is 960 units. What Cycle Time is necessary?
.1 min .7 min .5 min .2 min 1.0 min Assigning Tasks To Workstations Consider the above 5 tasks. If no parallel tasks are introduced calculate the maximum and minimum output capacity for these tasks for an 8 hour (480 minutes) day.
Assigning Tasks To Workstations The theoreticalminimumnumber (rounded up to the nearest whole number) of workstations necessary to achieve a Desired Output Capacity (D) is given by the following formula. The actual number of workstations necessary to achieve a Desired Output Capacity may be more than the theoretical minimum depending on how efficiently tasks can be grouped into work bundles (e.g. technical skill requirements, incompatible tasks, human factors, and equipment limitations may prohibit tasks from being placed in the same workstation)
.1 min .7 min .5 min .2 min 1.0 min Assigning Tasks To Workstations Consider the above 5 tasks. If no parallel tasks are introduced, and the line operates an 8 hour (480 minutes) day, what is the theoretical minimum number of workstations necessary to achieve a Desired Output Capacity of 480 units per day?
a b .1 min 1.0 min c d e .7 min .5 min .2 min Assigning Tasks To Workstations Consider the above 5 tasks. How many tasks follow task a?3 How many tasks follow task b?2 How many tasks follow task c?2 How many tasks follow task d?1
a b .1 min 1.0 min c d e .7 min .5 min .2 min Assigning Tasks To Workstations
Assigning Tasks To Workstations Workstation Time Remaining = CT - Σ(task times assigned) Idle Time = Workstation Time Remaining after assigning all tasks Percent Idle Time (sometimes referred to as BalanceDelay) Efficiency= 100 - Percent Idle Time
Line Balancing Procedure 1 - IdentifyCycleTime (CT)andcalculatetheoretical minimum number of workstations 2 - Make assignments to workstations in sequence (left to right) through the precedence diagram 3 - Before each assignment, use the following criteria: a. All preceding tasks in the sequence have been assigned b. The task time does not exceed the timeremaining 4 - After assignment calculate the timeremaining where time remaining = CT – sum of times assigned 5 - Break ties by using one of the following rules: a. Assign the task with the longest time b. Assign the task with the greatest number of followers c. If there is still a tie choose one arbitrarily 6 – Continue until all tasks are assigned
a b .1 min 1.0 min c d e .7 min .5 min .2 min Line Balancing - Example Example: Arrange the task shown in the diagram above into workstations using the LineBalancingProcedure . Use cycle time of 1.0 minute . Assign tasks in order of the most number of followers
a b .1 min 1.0 min Workstation 2 c d e .7 min .5 min .2 min Workstation 1 Workstation 3 Line Balancing - Example Percent Idle Time (Balance Delay) = 16.7% Efficiency = 83.3%
Other Approaches To Line Balancing Develop parallel processes to eliminate bottleneck operations (recall the car wash “rinsing” station discussion) Cross train workers to perform multiple tasks to minimize idle time and assist in bottleneck operations Develop mixed model lines to handle multiple (similar)productsNote: in practice it is very difficult to achieve perfectlybalanced lines. This is not entirely bad because the idle time at a workstation can reduce the impact on brief stoppages and can be used for workers that are not yet up to speed.
Dock Aisle Designing Process/Service Layouts In designing process/service layouts the challenge is to assign departments to locations(e.g. Warehouses, McDonald’s).As we discussed previously, a major obstacle in determining the optimumlayout is the large number of possibilities. Unfortunately, no algorithms exist to identify the best possible layout under all circumstances; therefore, operations managers must rely on heuristic (intuitive) rules and trial and error to develop satisfactory solutions. Some major considerations in designing process/service layouts are: . Transportation costs for material handling equipment and labor . Travel time between locations . Distance between locations . Initial layout cost . Effective capacity . The potential need to redesign the layout
Dry Groceries Frozen Foods Meats Check Out Vegetables Bread Designing Process/Service Layouts The information required to design a process/service layout includes the following: . List of departments with approximate dimensions and dimensions of building(s) that will house the layout . A projection of work flows between departments . The distance between locations . The cost per unit to move “work (loads)” between locations . The money to be invested in the creation of the layout . Special considerations such as departments that must be close together or must be separated
Designing Process/Service Layouts Minimizing the distance or transportation costs in moving loads from one location to another is the most common objective in designing process/service layouts. Distance, costs, and load relationships can be shown between departments and locations by creating a from-torelationshipmatrix for each. The distance from A to B = 20; the distance from B to A = 20 The loads/day from 1 to 2 = 10, the loads/day from 2 to 1 = 20
40 20 30 To A B C 20 30 From 40 80 10 30 To 1 2 3 20 70 From 90 Designing Process/Service Layouts We can graphically display the distancerelationship between the locations by using this schematic. We can graphically display the workflow (load) relationship between the departments by using this schematic.
40 x80 20 x10 30 x30 To A B C 20 x20 30 x70 From 40 x90 1 2 3 Designing Process/Service Layouts A distance-loadweighting can be calculated for the assignment of departments to locations by multiplying the distance relationship by the load relationship. For example: if we assign 1 to A, 2 to B and 3 to C the distance-load between locations can be described by the following schematic. The distance-load weighting for this assignment = 20x10 + 20x20 + 30x30 + 30*70 + 40*80 + 40x90 = 10,400 From
Because the number of the small number of assignment possibilities, we can determine the optimum assignment by calculating the distance-loadweighting for each alternative. Then select the one with the minimum value. Designing Process/Service Layouts So, the problem now becomes one of evaluating all possible assignments of departments to locations. This example is relatively easy since there are only 3! = 6 assignment possibilities. They are listed below: Obviously this approach is not feasible for large problems. The heuristic (intuitive) rule used in these cases is to assign greatest work flow (load) to closest departments
Minimizing Transportation Costs - Example Example 3: Using the previously described relationship matrices for Location and Departments, assign the departments (1, 2 and 3) to the locations (A, B, and C) in such a way that the transportation cost (in this case “workload distance”) is minimized. Apply the heuristic assign greatest work flow (load) to closest departments. Template TP06-02 Department Location Assignment Template has been provided to assist with this solution.
Minimizing Transportation Costs - Example First, enter the Location (Distances) and Department (Loads)
Minimizing Transportation Costs - Example Next, go to the Load Pairs tab and sort the load pairs by clicking the button. This automatically calculates the workflow (loads) between departments and ranks them from greatest to smallest. You see that the work flow is greatest between departments 1 and 3.
Minimizing Transportation Costs - Example Next, go to the Dist Pairs tab and sort the distance pairs by clicking the button. This automatically calculates the distance between departments and ranks them from greatest to smallest. You see that the distance is least between locations a and b
Minimizing Transportation Costs - Example This shows that Locations (A, B) are the closest and Department Work Flow is greatest between (1, 3). This means that there are two possible choices:
Minimizing Transportation Costs - Example Now, looking at the next closest and the nextgreatestWorkFlow shows that (B, C) and (2, 3) are the second choices. There are two possible choices for assignment in this case: Comparing the two assignments one can quickly rule out the second and third possibilities. Therefore the heuristic suggests:
40 x10 1 3 2 20 x80 30 x70 To A B C 20 x90 30 x30 From 40 x20 Minimizing Transportation Costs - Example Graphically this option can be displayed as follows: The distance-load weighting for this assignment = 20x80 + 20x90 + 30x70 + 30*30 + 40*10 + 40x20 = 7,600