Download
1 / 29
290 likes | 402 Vues
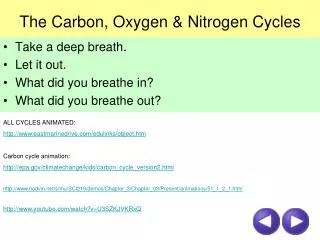
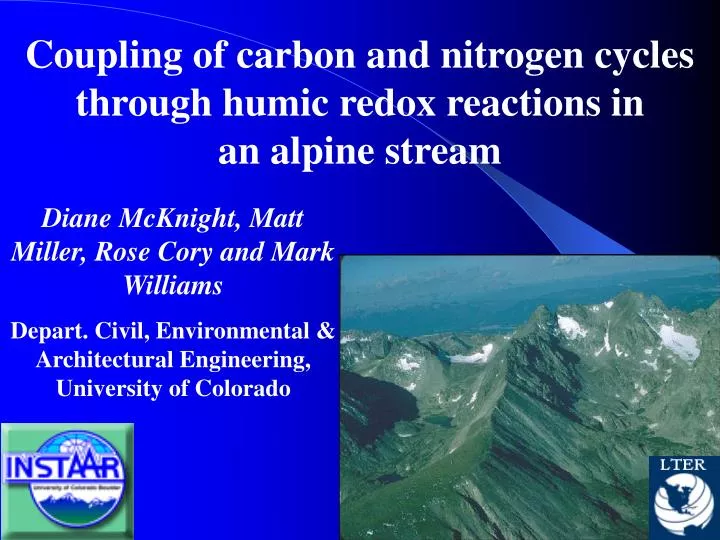
Coupling of carbon and nitrogen cycles through humic redox reactions in an alpine stream. Diane McKnight, Matt Miller, Rose Cory and Mark Williams Depart. Civil, Environmental & Architectural Engineering, University of Colorado. NWTLTER: C & N transport and reactivity in Green Lakes Valley.

E N D
Coupling of carbon and nitrogen cycles through humic redox reactions inan alpine stream Diane McKnight, Matt Miller, Rose Cory and Mark Williams Depart. Civil, Environmental & Architectural Engineering, University of Colorado
NWTLTER: C & N transport and reactivity in Green Lakes Valley Response of pristine, cold regions to climate change and N enrichment
Hyporheic Zone: “hotspot” of biogeochemical reactions driven by mixing across redox gradient
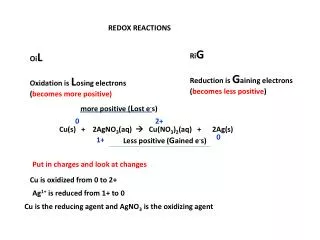
Redox Couples Oxidizing Conditions O2 H2O NO3- N2, NH4+ Mn(IV) Mn(II) Fe(III) Fe(II) Oxidized Humics Reduced Humics SO42- H2S Reducing Conditions
CO2 e- e- Acetate DOM reducing microorganism Reduced DOM Oxidized DOM Photoreduction of Ferric to Ferrous Iron Humics act as electron shuttle Fe3+ Fe2+ NO2-+ DOM DOM-N Ferrous Wheel Hypothesis NO3-
Tracer experiment: Navajo Meadow Stream *elevation~3,750m *formed by snowmelt and glacial runoff *surrounded by alpine wetland *~150m in length
Approach: Tracer injection experiment and modeling with OTIS Main Channel: Lateral inflow Advection Dispersion Transient storage Storage Zone: Transient storage s
Approach: Fluorescence index (Em450/Em500 @ 370 nm Ex, and EEM’s (Excitation and emission over a range of wavelengths) Excitation (nm) Emission (nm) Humic Peaks: (quinone moieties) Protein Peak
PARAFAC Excitation-emission matrix (EEM) Comp. 1 Comp. 2 Comp. 3
“HQ” “Q” Quinones found in enzymes, e.g ubiquinone, and formed by lignin oxidation. • Forms of this complex are found throughout cells • Important in electron transfer reactions, such as the oxidation of NADH • Also known as coenzyme Q Ubiquinone
Quinone fluorescence AQDS/AHDS useful as models for humic fluorescence
Stream Br- Addition, July 10 Background [Br-] = 0 mg/L Reach 3 Reach 2 Reach 1
Storage Zone Br- Simulation Reach 3 Reach2 Reach 1 0.1 mg/L 0.1 mg/L
Connectivity of wells • Br, Ca, del 18O & D on July 10 • Ca, del 18O & D on July 17, 24
Stream Chemistry July 17th July 10th July 24th DOC LF FI SR SUVA
Stream-Well Comparisons B A A A,B A B A,B A B B A A A FI Well 1 = No and Low Br, Well 2 = High Br
Stream Site EEMs S1 S2 S3 July 10th (tracer) July 17th July 24th
Well Site EEMs Characteristic Humic Peaks Protein Peaks July 10th, V13 July 17th, V15 July 17th, V25
PARAFAC Components Red-shifted: C2 (HQ1), C3 (HQ2) Blue-shifted: C5 (Q) Protein: C9 2 5
Ex, Em spectra for HQ1 and HQ2 Note: similar excitation spectra
Comparison of HQ1 and AHDS Em and Ex spectra: Same ex. max and shape. Emission max are different, probably related to H bonding, solvent, excited state rxns
Comparison of Q and AQDS Very similar ex and em max (ex 260 nm; em max at 418 nm). Similar features of spectra, Q has broader peaks as typical for humics
Stream-Well Comparisons C B C A A Well 1 = No and Low Br Well 2 = High Br F = (Σ HQ1, HQ2) / (Q)
CO2 e- e- Acetate DOM reducing microorganism Reduced DOM Oxidized DOM Photoreduction of Ferric to Ferrous Iron Humics act as electron shuttle Fe3+ Fe2+ NO2-+ DOM DOM-N Ferrous Wheel Hypothesis NO3-
Ferrous Wheel: Addition of Ferric Nitrate to reduced DOM samples with high ferrous iron concentrations, causes decrease in ferrous due to nitrate reduction. NOTE: Addition of Ferric Citrate causes ferrous iron to INCREASE.
Hyporheic zone interactions, e.g. humic redox!!, hotspot of C & N interactions, influencing N transport in alpine systems. Fluorescence index = HQ1/HQ2 FI increases with microbial sources (primary and secondary) Nitrogen and Carbon cycling coupled by biotic and chemical processes
Ferrous Wheel Results: Added Ferric Nitrate to Samples with high ferrous iron concentrations.. NOTE: get different results when ferric citrate added, in that case ferrous iron INCREASES.