Download
1 / 22
220 likes | 252 Vues
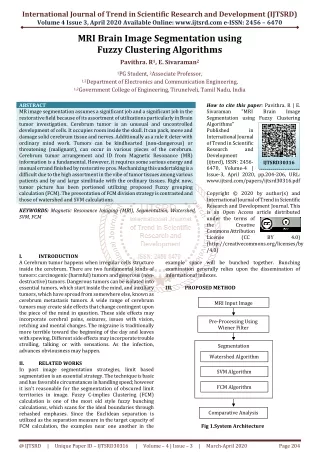
This project explores image segmentation through clustering in the color space, focusing on homogeneity and contrast for object extraction. The algorithm combines k-medoid and classification tree techniques, operating on RGB feature vectors for efficient computation. The project program includes a main file, color indexing, mean calculation, Euclidean distance function, and recursive clustering methods. Experiments yield segmented images of cherry flowers, houses, tigers, airplanes, cars, and people with different parameters, highlighting the impact on results. Advantages of the approach include flexibility in cluster numbers and user interactivity, but limitations include spatial data loss and sensitivity to noise and outliers.

E N D
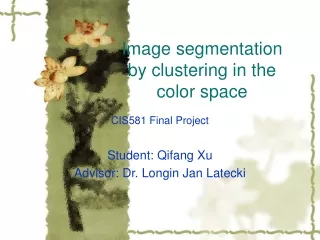
Image segmentation by clustering in the color space CIS581 Final Project Student: Qifang Xu Advisor: Dr. Longin Jan Latecki
Content • Introduction • Project Algorithm • Project program • Experiments and results • Conclusion
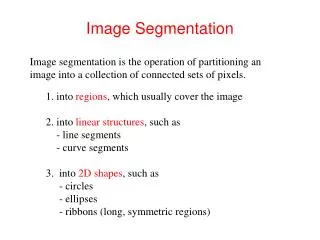
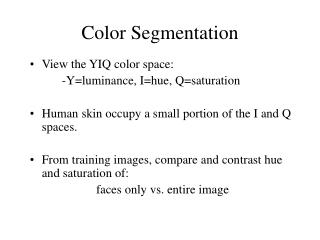
Introduction • Image segmentation is to find objects or meaningful part of objects. • Two types of segmentation methods • homogeneity • contrast • Image segmentation techniques • region growing and shrinking • clustering methods • Boundary detection
Clustering Techniques • Segment an image by grouping each elements based on some measure of similarity • Domain spaces • spatial domain (row-column (rc) space) • color space • histogram spaces • other complex feature space
Clustering Algorithms • Basic idea 1. Iteratively divide the space of interest into regions by median. 2. stop when the specific criteria is reached. k-means clustering • Recursive region splitting algorithm standard technique 1. compute histograms for each component of interest (red, green, blue) 2. select a best threshold to split the image into two regions 3. Repeat 1 and 2, until no new regions can be created
Project Algorithm • A combination of the k-medoid algorithm and classification tree’s techniques • Feature space: RGB • Computation time is linear to the number of feature vectors • Flow chart for the project
Project program (1) • Main file: rgbcluster.m firstauto3(inputFileName, mnp, percent) inputFileName: image for segmentation mnp: Minimal number of points in each cluster percent: parameter that delays clustering of points in a margin region. Value: 0.01-- 0.1. Normal value: 0.05. output: a set of clusters
Project program (2) • Color index each entry: R G B weights weight is the number of pixels for this color function [colorWeights] = getStat(data, map) colorWeights = map; [row, col] = size(map); for i = 1:row tmp = find(data==i); colorWeights(i, col+1) = length(tmp); end return;
Project program (3) • Means meanR = meanG = meanB =
Codes for find rgb mean function [mn] = find_mean(data) [row, col] = size(data); sumR = 0; sumG = 0; sumB = 0; count = 0; for i = 1:row sumR = sumR + data(i, 1) * data(i, col); sumG = sumG + data(i, 2) * data(i, col); sumB = sumB + data(i, 3) * data(i, col); count = count + data(i, col); end thisMean(1) = sumR / count; thisMean(2) = sumG / count; thisMean(3) = sumB / count; mn = thisMean; return;
Project program (4) • Distance: Euclidean distance between two points • Codes function [dist] = dist2pt(x, y) dist = sqrt((x(1)-y(1))^2 + (x(2)-y(2))^2 + (x(3)-y(3))^2); return;
Project program (5) • Split2.m (provided by Dr. Latecki) [lmainindex,rmainindex,ldata,ldist,rdata,rdist,cluster,no,centroid] = split2(data,dist,a,mainindex,scale,mnp,percentage,cluster,no,centroid)
Project program (6) • recurauto1.m: recursively split data into clusters (provided by Dr. Latecki) 1. distance histogram (myhist) 2. threshold (evo2) 3. split (split2) 4. find left distance, go to left branch 5. find right distance, go to right branch 6. no new split, stop • Unclustered points assigned to the clusters with closest distance to the centroids.
Experiments and results • Rgb pictures • Cherry flowers • House • tiger • airplane • car • people
Resluts 1 Original pictures segmented pictures Mnp: 30, percent 0.05, cluster number 4 Mnp : 20, percent 0.05, cluster number 7
Results 2 Original pictures Segmented pictures Mnp: 10, percent 0.05, cluster number: 9 Mnp: 50, percent 0.05, cluster number: 3
Results 3 Original pictures segmented pictures Mnp: 10, percent: 0.05, cluster number: 11 Mnp: 30 Percent: 0.05 Cluster number: 4
Original picture Mnp:10, cluster number: 15 Mnp: 30, Cluster number: 4
Conclusion • Advantages • no predefined cluster number • user interactive • computation time • Disadvantages • spatial information lost • Cannot deal with noise or outliers