Download
1 / 17
180 likes | 346 Vues
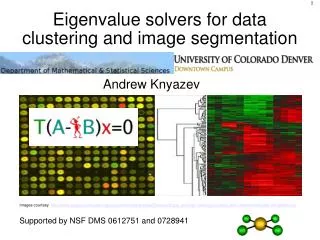
Eigenvalue solvers for data clustering and image segmentation. Andrew Knyazev Images courtesy http://www.biosci.utexas.edu/mgm/people/faculty/profiles/VIresearch.jpg and http://www.gps.caltech.edu/~edwin/molecular_vibrations.htm Supported by NSF DMS 0612751 and 0728941.

E N D
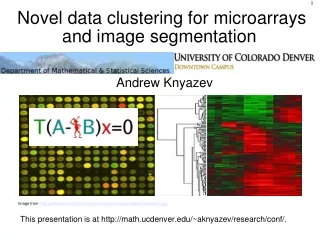
Eigenvalue solvers for data clustering and image segmentation Andrew Knyazev Images courtesy http://www.biosci.utexas.edu/mgm/people/faculty/profiles/VIresearch.jpg and http://www.gps.caltech.edu/~edwin/molecular_vibrations.htm Supported by NSF DMS 0612751 and 0728941
Eigensolvers for data clustering: • Eigenproblems in mechanical vibrations • The Schrödinger and Kohn-Sham equations • Clustering: why? • Clustering: how? • Spectral clustering • Connection to image segmentation • Eigensolvers for spectral clustering
Eigenproblems in mechanical vibrations Free transversal vibration without damping of the mass-spring system is described by the ODE system Standing wave assumption leads to the eigenproblem Component xi describes the up-down movement of mass i. Images courtesy http://www.gps.caltech.edu/~edwin/MoleculeHTML/AuCl4_html/AuCl4_page.html
The Schrödinger equation The time independent (standing wave) equation The Kohn-Sham equation for electronic orbitals keeps the supercomputers busy calculating. What is next?
Clustering data: why? • Possible scenarios: • Studying processes over time (functional clustering): • Measuring the response to a drug or food in medicine and biology and determining co-regulated factors and organisms • Analysing the stock market data and finding similarity and dissimilarity between different stocks • Locating a moving object in a video, e.g., a human face, or a car license plate • Looking for differences or similarities between states: • Normal cells versus cancer cells in medical imaging • Fingerprint identification • Automatic categorizing of Web text documents • Clustering helps the reverse engineering.
Clustering: how? The overview There is no good widely accepted definition of clustering. The traditional graph-theoretical definition is combinatorial in nature and computationally infeasible. Heuristics rule! Good open source software, e.g., METIS and CLUTO. Clustering can be performed hierarchically by agglomeration (bottom-up) and by division (top-down). Agglomeration clustering example
Clustering: how? Co-clustering Two-way clustering, co-clustering or bi-clustering are clustering methods where not only the objects are clustered but also the features of the objects, i.e., if the data is represented in a data matrix, the rows and columns are clustered simultaneously! Image courtesy http://www.gg.caltech.edu/~zhukov/research/spectral_clustering/spectral_clustering.htm
Clustering: how? Algorithms Partitioning means determining clusters. Partitioning can be used recursively for hierarchical division. Many partitioning methods are known. Here we cover: • K-means (centroids) • Spectral partitioning using Fiedler vectors = Principal Components Analysis (PCA) PCA/spectral partitioning is known to produce high quality clusters, but is considered to be expensive as solution of large-scale eigenproblems is required. Our expertise in eigensolvers comes to the rescue!
K-means (centroids) clustering The K-means algorithm assigns each point to the cluster whose center (called centroid) is nearest. The center is the average of all the points in the cluster. The initial centroids are placed randomly (left), then are moved iteratively (center) until convergence (right). The “relaxed” K-means is equivalent to the spectral clustering, discussed next.
Spectral clustering in mechanics The main idea comes from mechanical vibrations and is intuitive: in the spring-mass system the masses which are tightly connected will have the tendency to move together synchronically in low-frequency free vibrations. Analysing the signs of the components corresponding to different masses of the low-frequency vibration modes of the system allows us to determine the clusters of the masses! A 4-degree-of-freedom system has 4 modes of vibration and 4 natural frequencies: partition into 2 clusters using the second eigenvector: Images Courtesy: Russell, Ketteriung U.
Spectral clustering for simple graphs Undirected graphs with no self-loops and no more than one edge between any two different vertices • A = symmetric adjacency matrix • D = diagonal degree matrix • Laplacian matrix L = D – A L=K describes transversal vibrations of the spring-mass system (as well as Kirchhoff's law for electrical circuits of resistors)
Spectral clustering for simple graphs The Laplacian matrix L is symmetric with the zero smallest eigenvalue and constant eigenvector (free boundary). The second eigenvector, called the Fiedler vector, describes the partitioning. • The Fiedler eigenvector gives bi-partitioning by separating the positive and negative components only • By running the K-means on the Fiedler eigenvector one could find more then 2 partitions if the vector is close to piecewise-constant after reordering • The same idea for more eigenvectors of Lx=λx Example Courtesy: Blelloch CMU 1 2 5 3 www.cs.cas.cz/fiedler80/ 4 Rows sum to zero
PCA clustering for simple graphs • Fiedler vector is an eigenvector of Lx=λx, in the spring-mass system this corresponds to the stiffness matrix K=L and to the mass matrix M=I (identity) • Should not the masses with a larger adjacency degree be heavier? Let us take the mass matrix M=D -the degree matrix • So-called N-cut smallest eigenvectors of Lx=λDx are the largest for Ax=µDx with µ=1-λ since L=D-A • PCA for D-1A computes the largest eigenvectors, which then can be used for clustering by the K-means • D-1A is raw-stochastic and describes the Markov random walk probabilities on the simple graph
Connection to image segmentation Image pixels serve as graph vertices. Weighted graph edges are computed by comparing pixel colours. Here is an example displaying 4 Fiedler vectors of an image: We generate a sparse Laplacian, by comparing neighbouring pixels here when computing the weights for the edges, getting a sparse Laplacian (with a small fill-in). Megapixel images lead to eigenproblems with millions of degrees of freedom.
Eigensolvers for spectral clustering • Our BLOPEX-LOBPCG software has proved to be efficient for large-scale eigenproblems for Laplacians from PDE's and for image segmentation using multiscale preconditioning of hypre • The LOBPCG for massively parallel computers is available in our Block Locally Optimal Preconditioned Eigenvalue Xolvers (BLOPEX) package • BLOPEX is built-in in http://www.llnl.gov/CASC/hypre/ and is included as an external package in PETSc, see http://www-unix.mcs.anl.gov/petsc/ • On BlueGene/L 1024 CPU we can compute the Fiedler vector of a 24 megapixel image in seconds (including the hypre algebraic multigrid setup).
Recommended reading • Spectral Clustering, Ordering and Ranking: Statistical Learning with Matrix Factorizations by Chris Ding and Hongyuan Zha, Springer, 1 edition (December 2008) ISBN-13: 978-0387304489 • Internet and Wikipedia search “Spectral Clustering” • These slides and other similar talks on my Web at http://math.cudenver.edu/~aknyazev/research/conf/
Conclusions • The spectral clustering rulez! • Our eigenxolvers efficiently find clusters for very large data sets and perform image segmentation • Spectral clustering has an intuitive explanation using the mechanical vibration model • 1$ million question for our future research: how the spectral clustering is connected to the Kohn-Sham approximation of the Hamiltonian in the Schrödinger equation?